RL Is Worth N Samples
RL fine-tuning of an image model is worth a fixed number of best-of-N samples, and that number depends on who judges. One Flow-GRPO sample matches more than 32 base samples on PickScore, about 4 on ImageReward, and fewer than one on CLIPScore.
Thesis. We measure how many best-of-N samples from a base text-to-image model match one sample from its RL checkpoint. For Flow-GRPO on SD3.5-Medium, the answer depends on the scorer: more than 32 on PickScore, about 4 on ImageReward, and no match at N ≥ 1 on CLIPScore because even the base mean is higher.
Main technical point. The fit \(\mu + \sigma e_N\) explains the measured best-of-N curves closely, with R² between 0.98 and 1.00. On the rewards it improves, Flow-GRPO raises the mean and reduces the fitted spread by 24 to 47 percent. The base does not catch up within our measured budgets on rewards that RL improves.
Practical implication. Report RL checkpoints with best-of-N curves and a search-equivalent budget on held-out scorers, and check prompt faithfulness at large N, where RL can leave a model worse than its base at every budget.
Motivation
RL fine-tuning aims to raise reward-model scores. Best-of-N search also uses a scorer, but selects among several generated images at inference. We wanted to know how these two fit together. Does an RL checkpoint leave enough variation for search to keep helping?
The question came up while we were planning to train diffusion models for best-of-N instead of for the average, an idea from pass@k training for language models[1][2][3]. That plan only makes sense if today's RL models are bad at best-of-N. So before training anything, we measured it.
A little math shows the tension. RL maximizes the average reward of one sample from the model \(p_\theta\):
\[ J_{\text{RL}} = \mathbb{E}_{x \sim p_\theta}\,[\,r(x)\,] \]
At deployment we draw N samples and keep the best, so the quantity we care about is
\[ J_N = \mathbb{E}_{x_1,\dots,x_N \sim p_\theta}\big[\max_i r(x_i)\big] \approx \mu + \sigma\, e_N . \]
Here \(\mu\) and \(\sigma\) are the mean and spread of the reward over a prompt's samples, and \(e_N\) is the expected best of N standard normal draws∗: 0.56 for N = 2, 1.42 for N = 8, 2.07 for N = 32. RL raises \(\mu\). If it also shrinks \(\sigma\), every extra sample buys less, and RL stays ahead at budget N only while
∗\(e_N\) has closed forms only for very small N. We integrate it numerically; it grows roughly like \(\sqrt{2\ln N}\).\[ \Delta\mu \;>\; e_N\,(\sigma_{\text{base}} - \sigma_{\text{RL}}) . \]
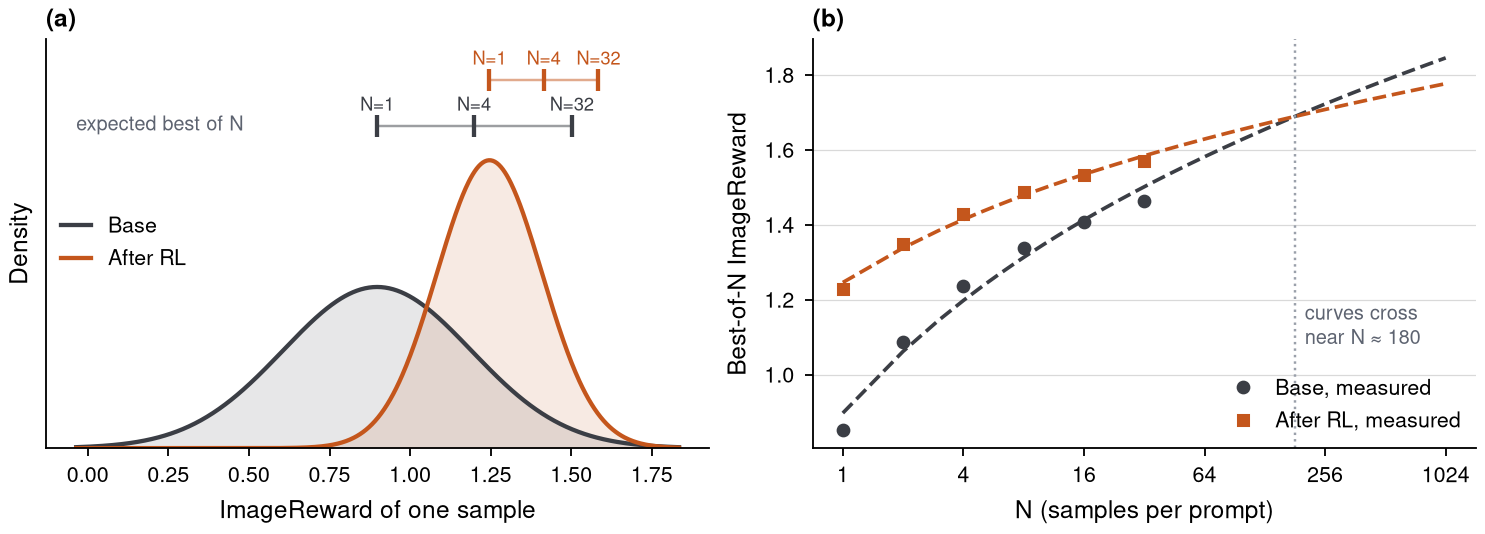
That leaves three questions for real checkpoints. How many base samples is one RL sample worth? How much does RL shrink what search can add? And if you are going to rerank anyway, is RL still worth training?
Background
Text-to-image post-training can include supervised fine-tuning on curated images, preference optimization, or online reward-based updates. Here we study released checkpoints from Flow-GRPO and DiffusionNFT. Their training procedures differ, but both use reward signals to change which images the model produces. [5][6][4][7]
At inference, best-of-N draws N images from different seeds and keeps the one a scorer ranks highest. It needs no training or scorer gradients. Its gain depends on the distribution of scores across candidates; visual diversity alone does not guarantee a useful high-scoring tail. [8]
Setup
We compared public RL checkpoints of Stable Diffusion 3.5 Medium[9] with the base model, each under the sampling setting its authors evaluate with†:
†Flow-GRPO reports results at classifier-free guidance 4.5[10]; DiffusionNFT samples without guidance. Each RL model is compared with its base under the same setting.- Flow-GRPO, trained on PickScore, with and without its KL penalty, sampled at CFG 4.5.
- DiffusionNFT, trained on a mix of rewards that includes PickScore, sampled without guidance.
Each model drew 32 images for each of 100 DrawBench prompts[11], starting from the same noise, and we scored every image with six reward models: PickScore, HPSv2, HPSv3[12], ImageReward[13], CLIPScore[14] and an aesthetic predictor[15]. We then repeated the study on Z-Image-Turbo[16]. For best-of-N we do not resample. From n scored images, the expected best of a random subset of size N has a closed form in the sorted scores \(s_{(1)} \le \dots \le s_{(n)}\), the max@k version of the unbiased pass@k estimator[17]:
\[ \mathbb{E}[\max \text{ of } N] = \sum_{m=N}^{n} \frac{\binom{m-1}{N-1}}{\binom{n}{N}}\, s_{(m)} . \]
This computes the expected maximum over subsets of the collected pool exactly, without Monte Carlo subset resampling. The pool itself is finite, so the estimate still has uncertainty across prompts and generated samples. The details are in How we ran this.
Results on SD3.5-M
RL wins on its own reward
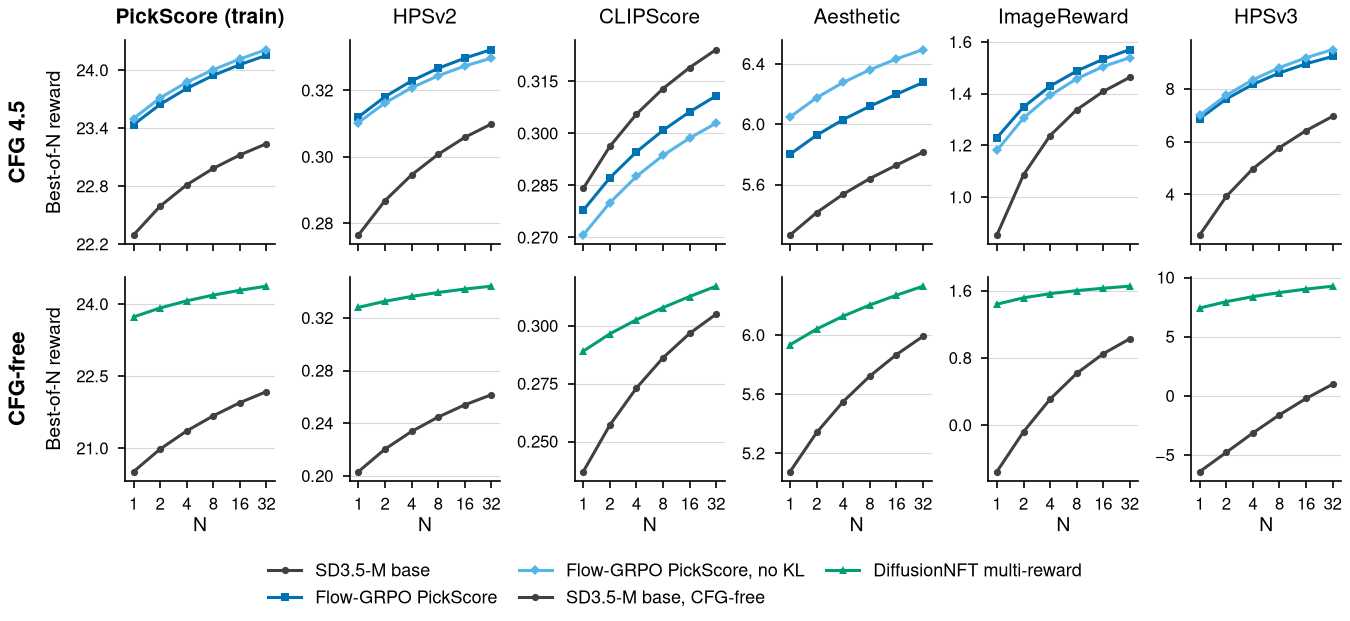
With guidance, one Flow-GRPO sample scores 23.44 on PickScore. The base model reaches 23.24 only at best of 32. The RL curves stay above the base curves at every N on every reward that RL improved to begin with.
Measuring RL in samples
This suggests one number per checkpoint and scorer: the search-equivalent budget, the N at which the base model's best-of-N matches one RL sample. We read it off the base curve, interpolating in log N.
| Scorer | Flow-GRPO | Flow-GRPO, no KL | DiffusionNFT |
|---|---|---|---|
| PickScore | > 32 | > 32 | > 32 |
| HPSv2 | > 32 | > 32 | > 32 |
| HPSv3 | 29 | > 32 | > 32 |
| Aesthetic | 29 | > 32 | 23 |
| ImageReward | 3.9 | 3.1 | > 32 |
| CLIPScore | < 1 | < 1 | 9.7 |
The same Flow-GRPO checkpoint exceeds the base at N = 32 on PickScore and matches roughly N = 4 on ImageReward. On CLIPScore, even the base at N = 1 scores higher. A single number for “RL improvement” would hide that disagreement between scorers.
RL shrinks the gain from search
Fitting \(\mu + \sigma e_N\) to each curve explains the pattern. Flow-GRPO raises the mean and cuts the spread by 24 percent on PickScore, 44 percent on ImageReward and 47 percent on HPSv3. In raw numbers, best of 32 adds 0.94 PickScore to the guided base and 0.72 to Flow-GRPO, and 0.61 versus 0.34 on ImageReward. DiffusionNFT loses more: search adds 1.58 ImageReward to its base and 0.21 to the RL model.
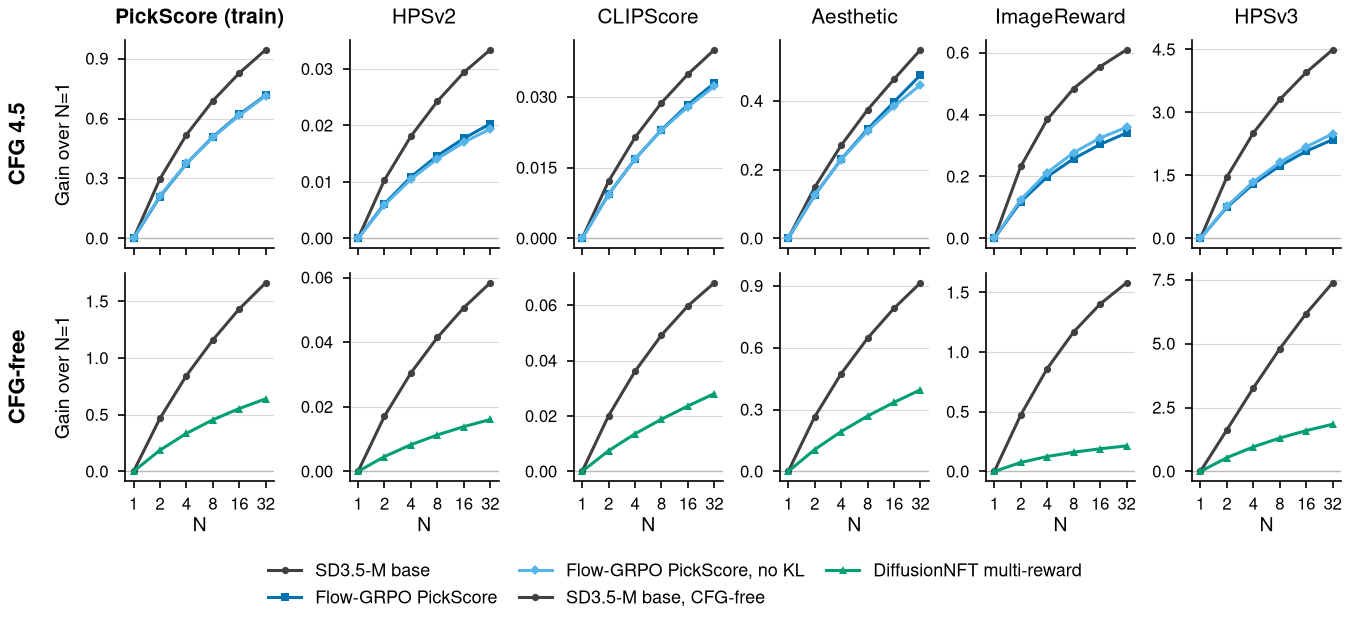
Extrapolating the fitted curves suggests a crossover around 180 samples on ImageReward and tens of thousands on HPSv3, with a still larger budget on PickScore. These are model-based projections beyond our 32-sample measurements. They depend strongly on the unobserved reward tails and should not be read as measured crossover points. ‡
‡These crossings extrapolate a two-parameter fit well beyond N = 32. Read them as orders of magnitude.Diversity metrics and search
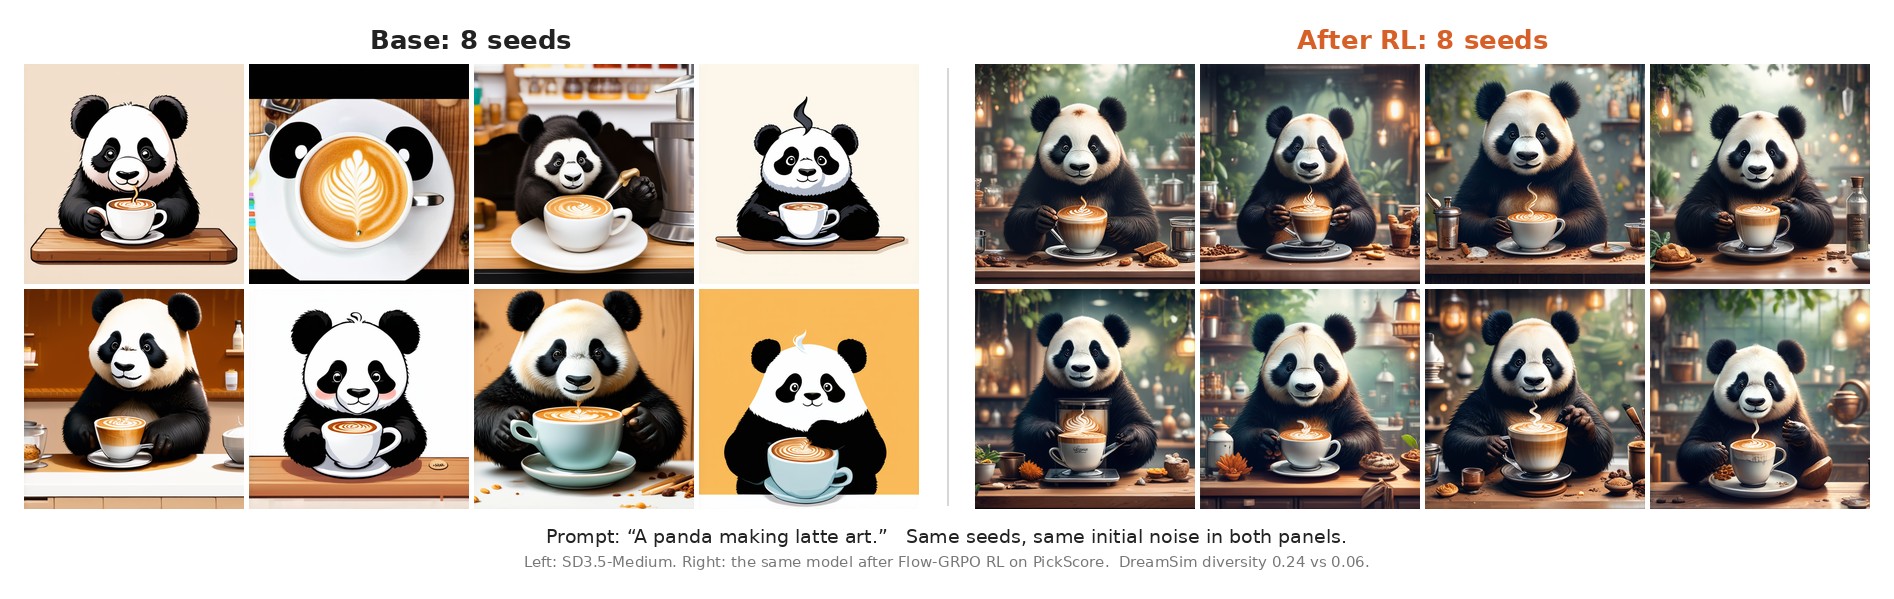
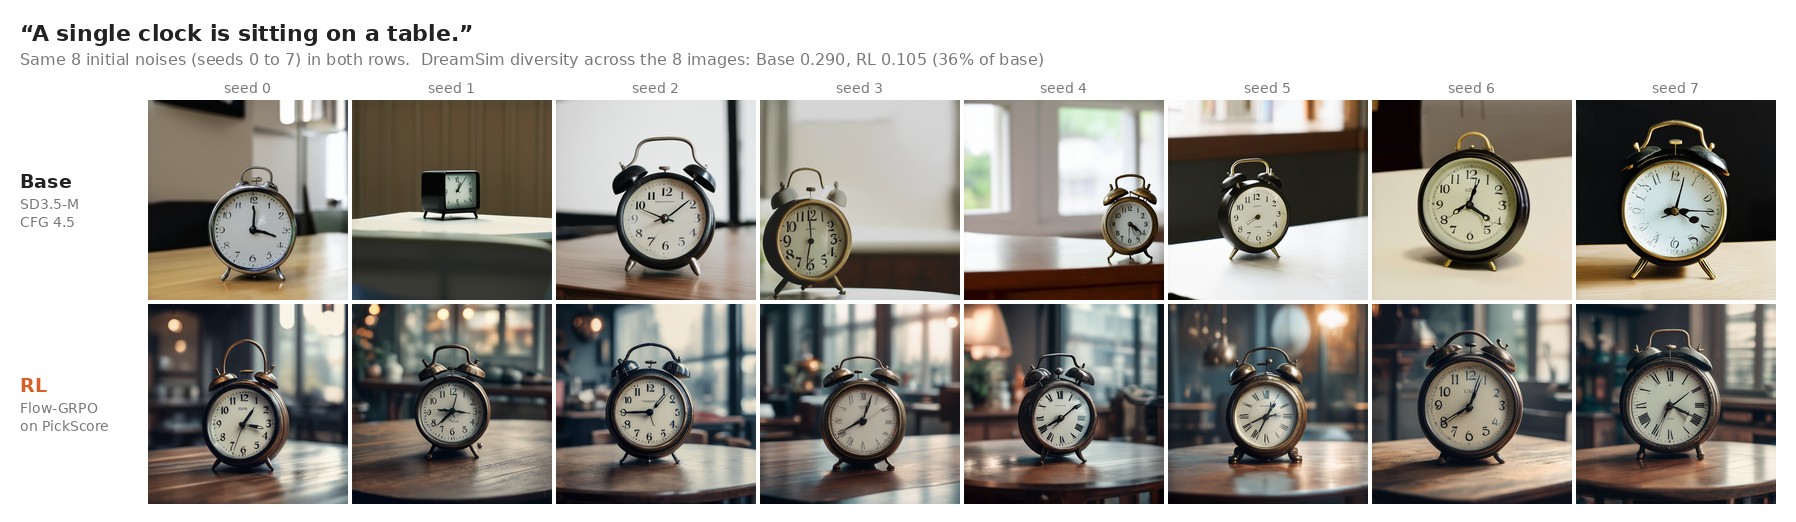
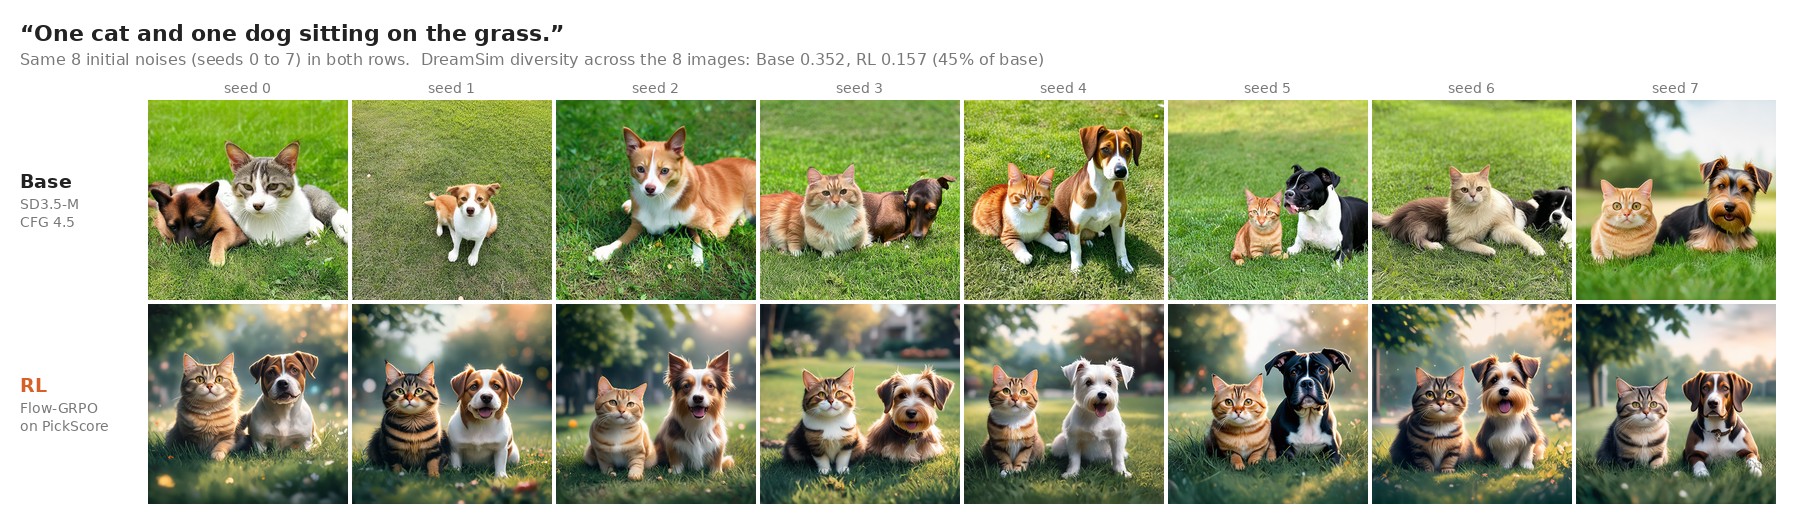
The usual answer to RL collapse is to report a diversity score, such as DreamSim distance[18] or the Vendi score[19], and to keep a KL penalty toward the base. Neither tracks what search can recover. Without the KL penalty Flow-GRPO is less diverse (Vendi 2.9 against 3.3, with 5.3 for the base) and its best-of-N gains are about the same on every reward. From base to Flow-GRPO, Vendi falls 37 percent while the search gain on PickScore falls 24 percent.
Guidance also changes diversity. CFG 4.5 cuts the base model's Vendi score from 12.7 to 5.3 over 32 seeds. DiffusionNFT, which runs without guidance, has a Vendi score near 2. This is an effective diversity measure, not a count of exactly two unique images.
Prompt faithfulness
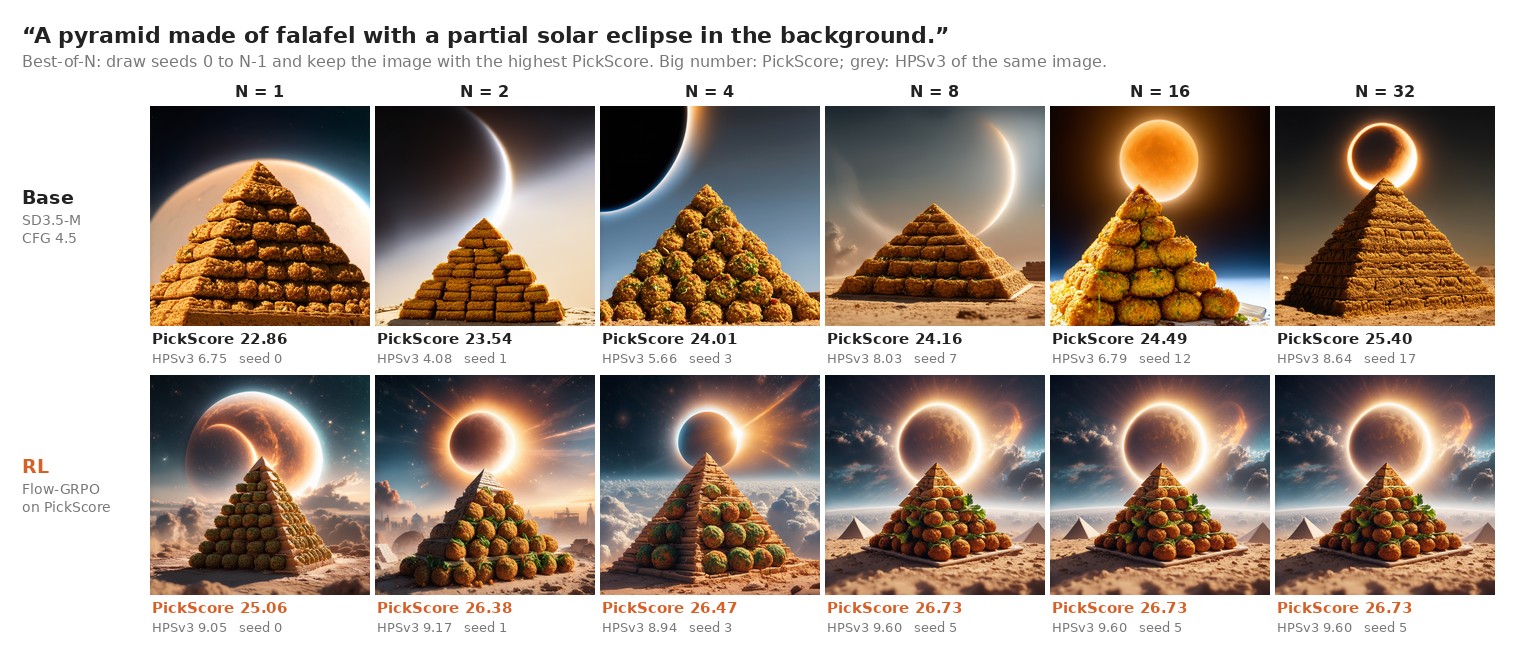
CLIPScore is lower for the RL model at every tested budget. It is a proxy for image-text similarity, rather than a complete test of prompt faithfulness. On 80 percent of prompts, Flow-GRPO's best of 32 has lower CLIPScore than the base model's best of 32. The examples below show some of the prompt details that search fails to recover.
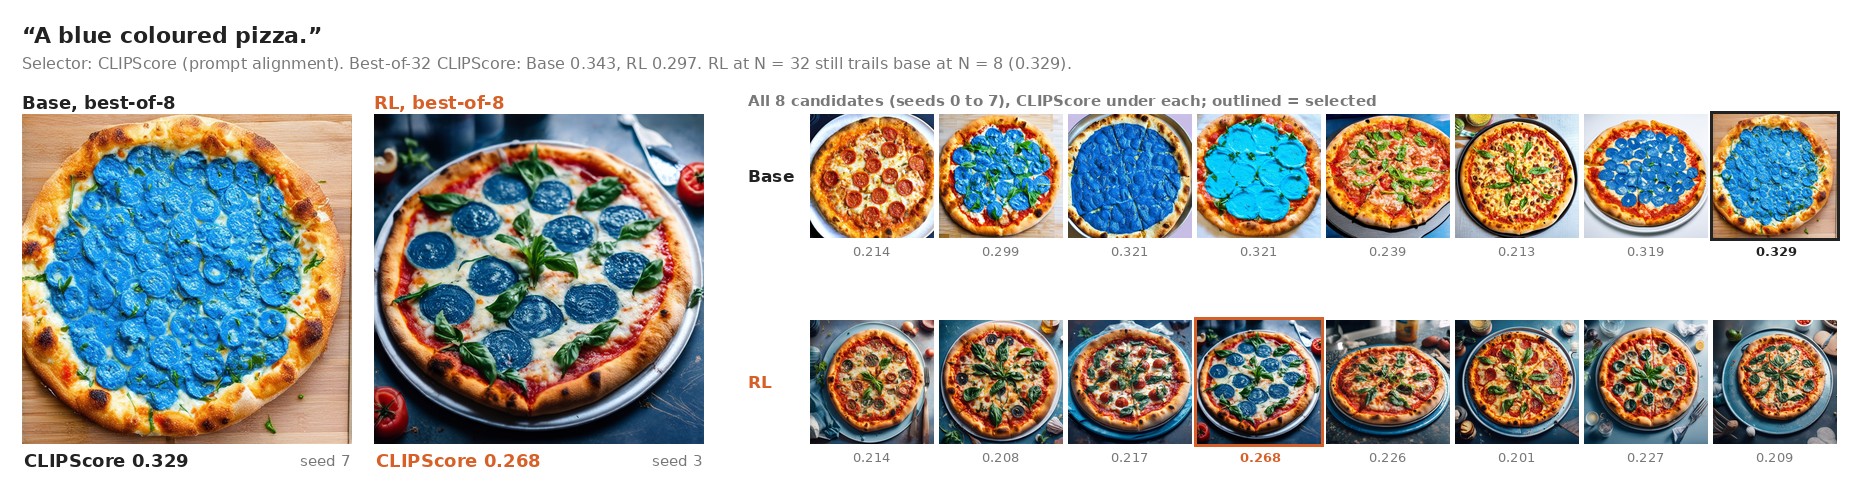
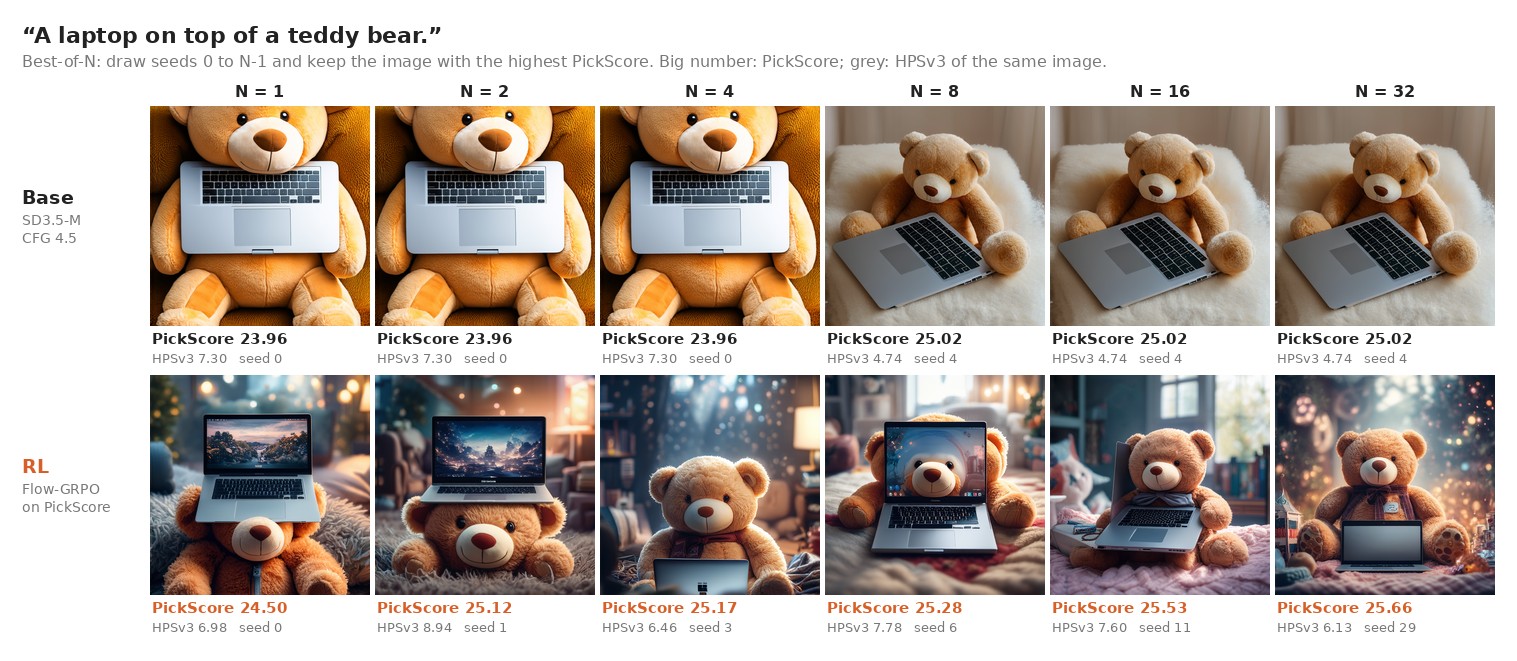
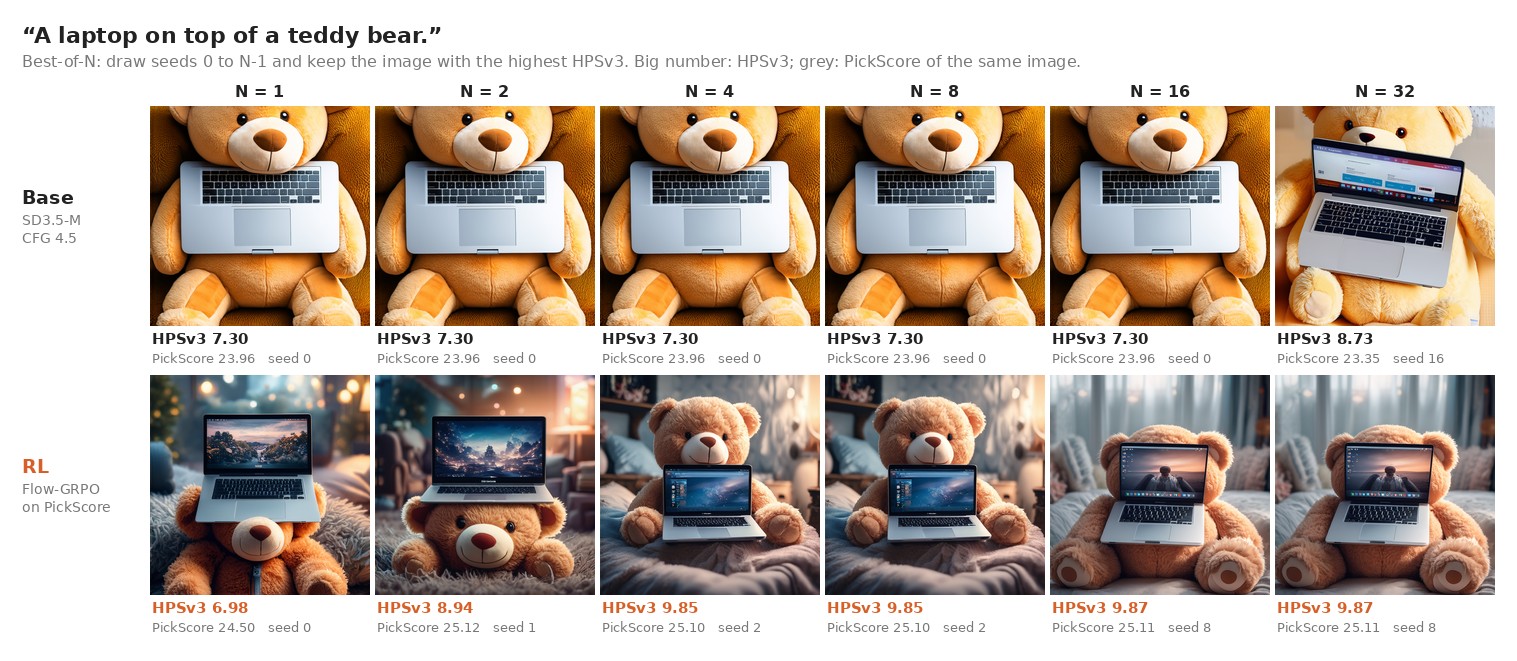
The scorer used for reranking matters too. Ranking the same 32 images by PickScore or by HPSv3 picks different winners at almost every N, and sometimes the winner breaks the prompt.
Results on Z-Image-Turbo
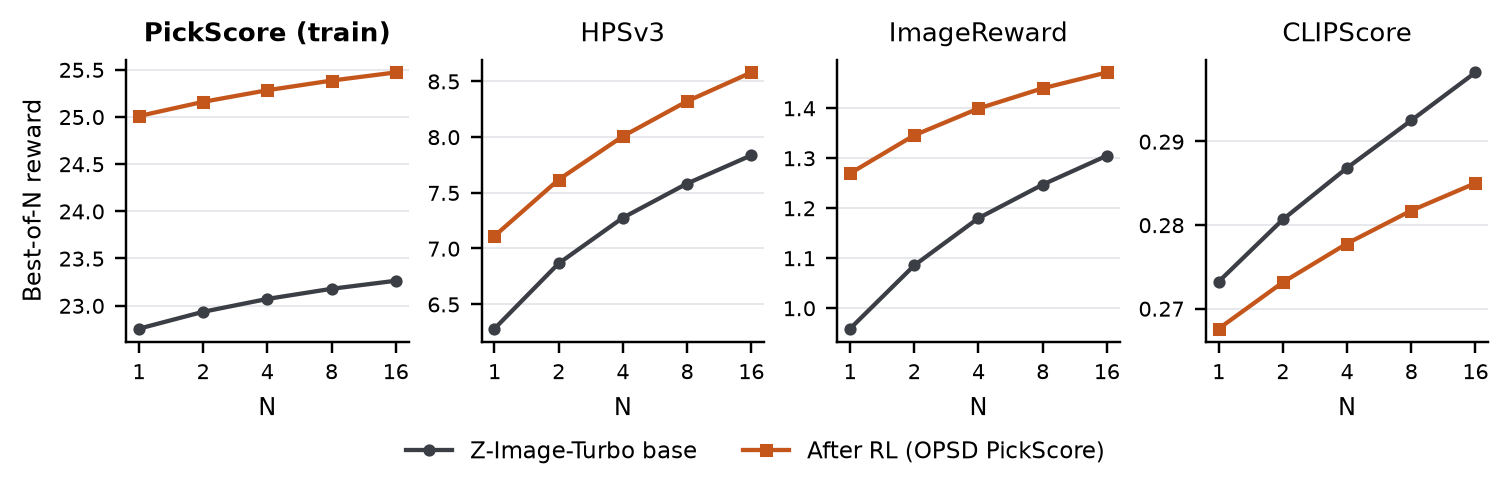
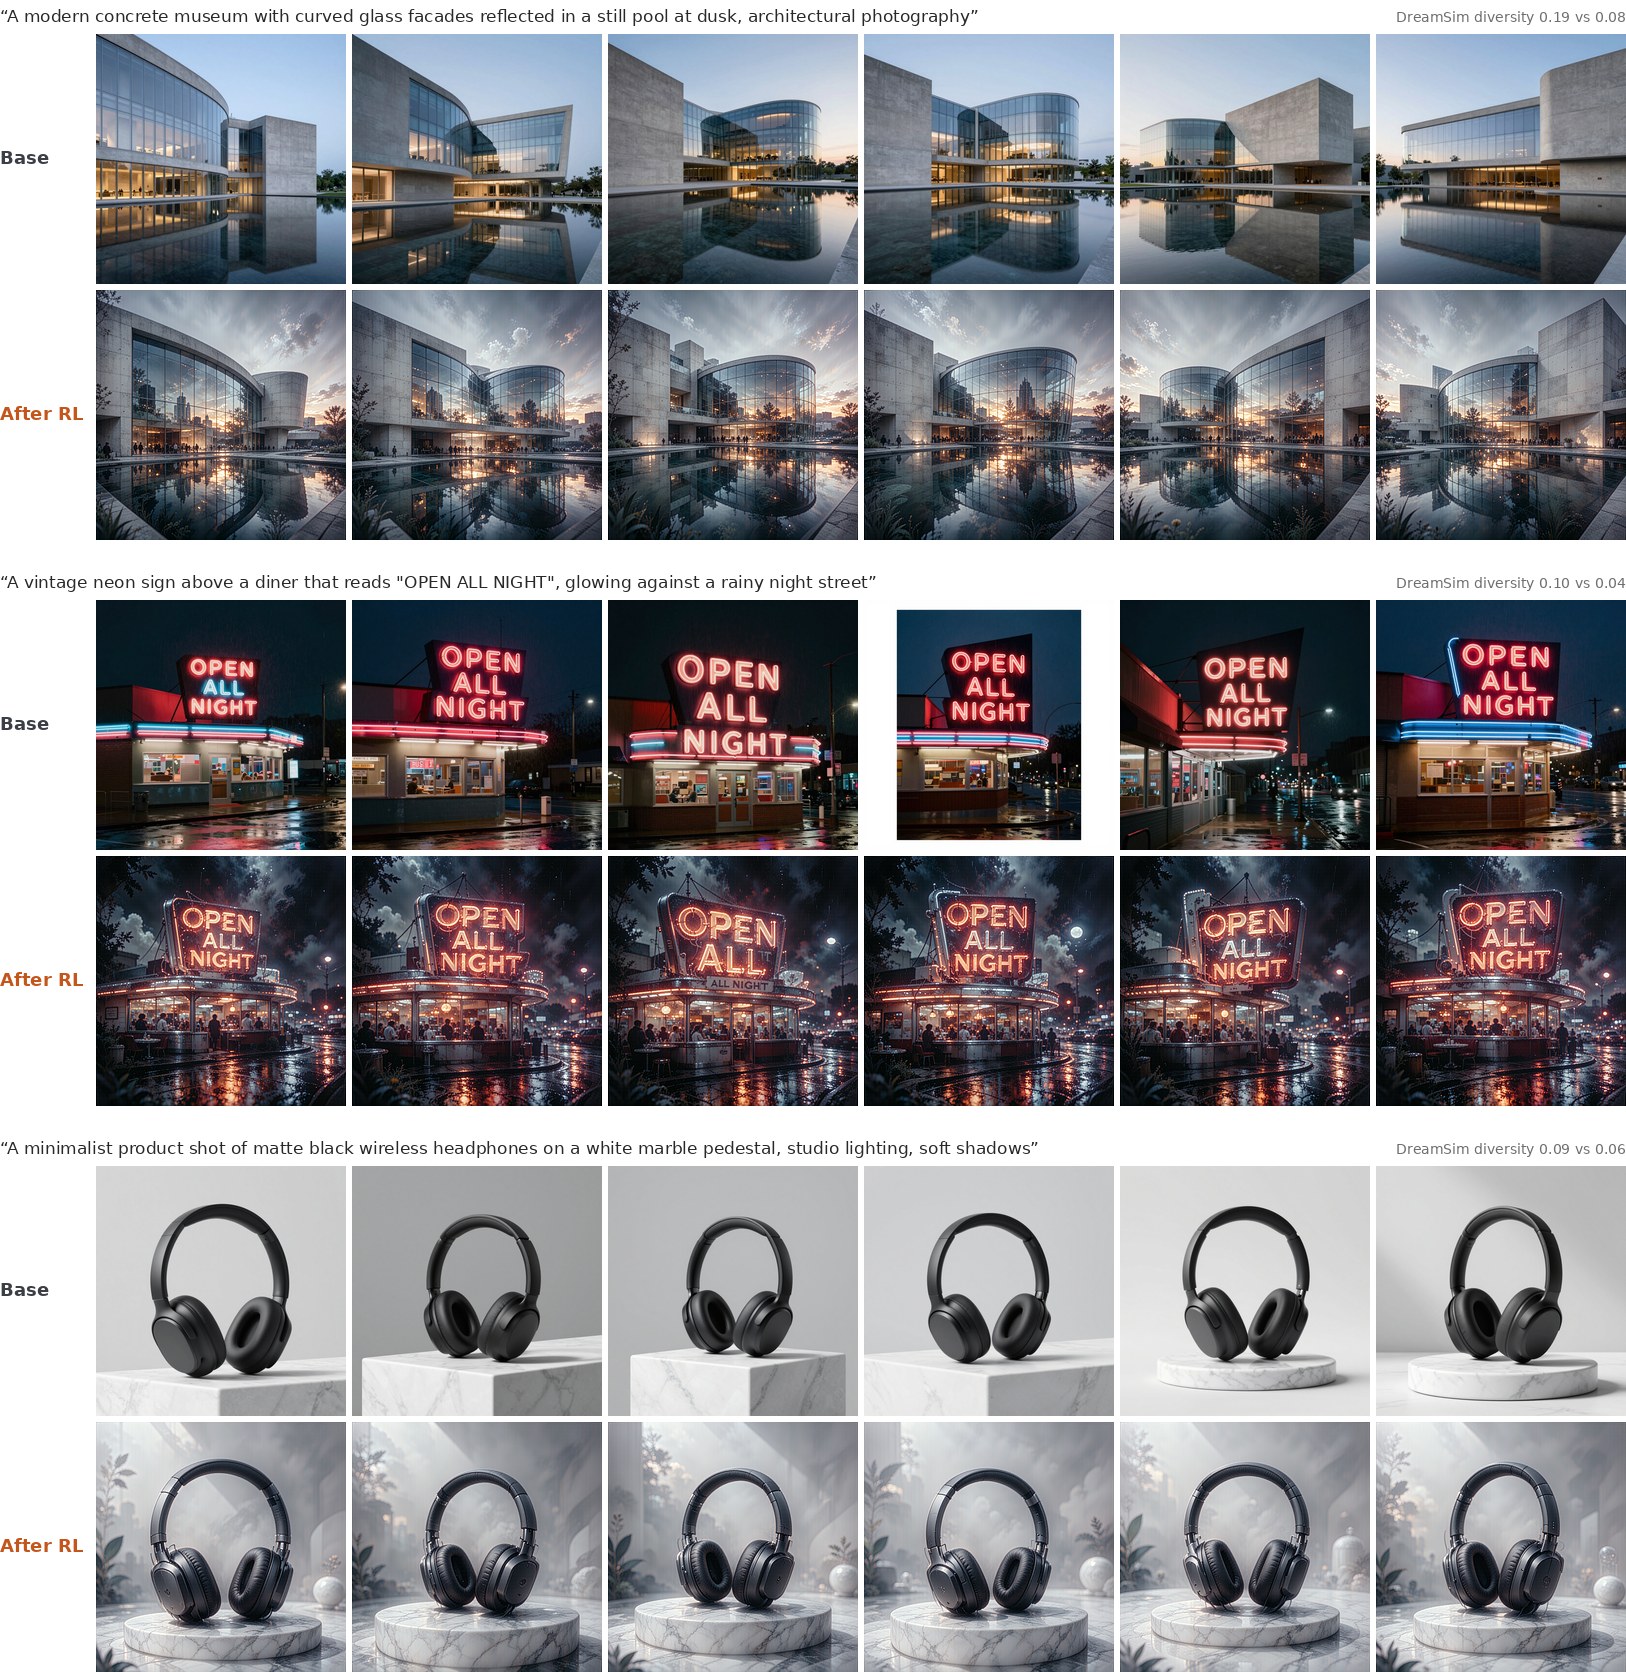
We repeated the study on Z-Image-Turbo, a 6B model sampled in 9 steps, against a version fine-tuned with RL on PickScore: 50 DrawBench prompts, 16 seeds each, at 1024 px. The base already has low measured diversity, with a Vendi score of 2.3, falling to 1.6 after RL. This comparison alone does not isolate how much of that low diversity comes from distillation. §
§The RL LoRA is the one released with DiffusionOPSD[20], the only public RL checkpoint for Z-Image-Turbo we found.With so little spread, search helps neither model much. Best of 16 adds 0.51 PickScore to the base and 0.46 to the RL model, while the RL lead is 2.25. On held-out scorers one RL sample is worth about 3 base samples to HPSv3 and about 10 to ImageReward. On CLIPScore the RL model starts lower and the gap more than doubles by N = 16.
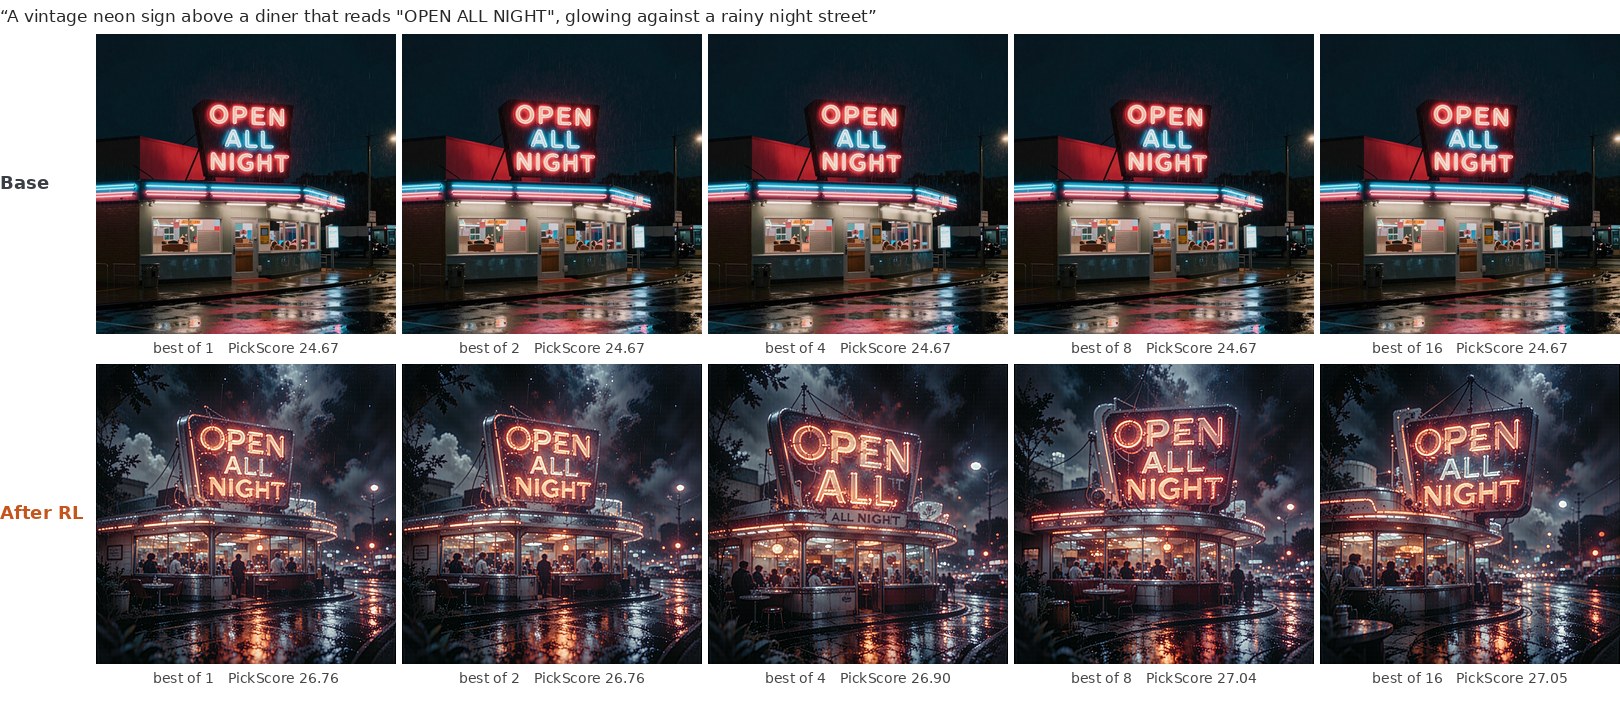
Gallery at 2048 px
Six prompts we wrote for this post, generated at 2048 px with four seeds per model¶. PickScore rates the RL image higher in every pair. RL rewards heavier texture, dramatic backlight and extra props: the "minimalist" headphone shot gains mist and plants, and the reading nook gains clutter.
¶We picked one image per model and prompt by eye. Click an image to open it at full resolution.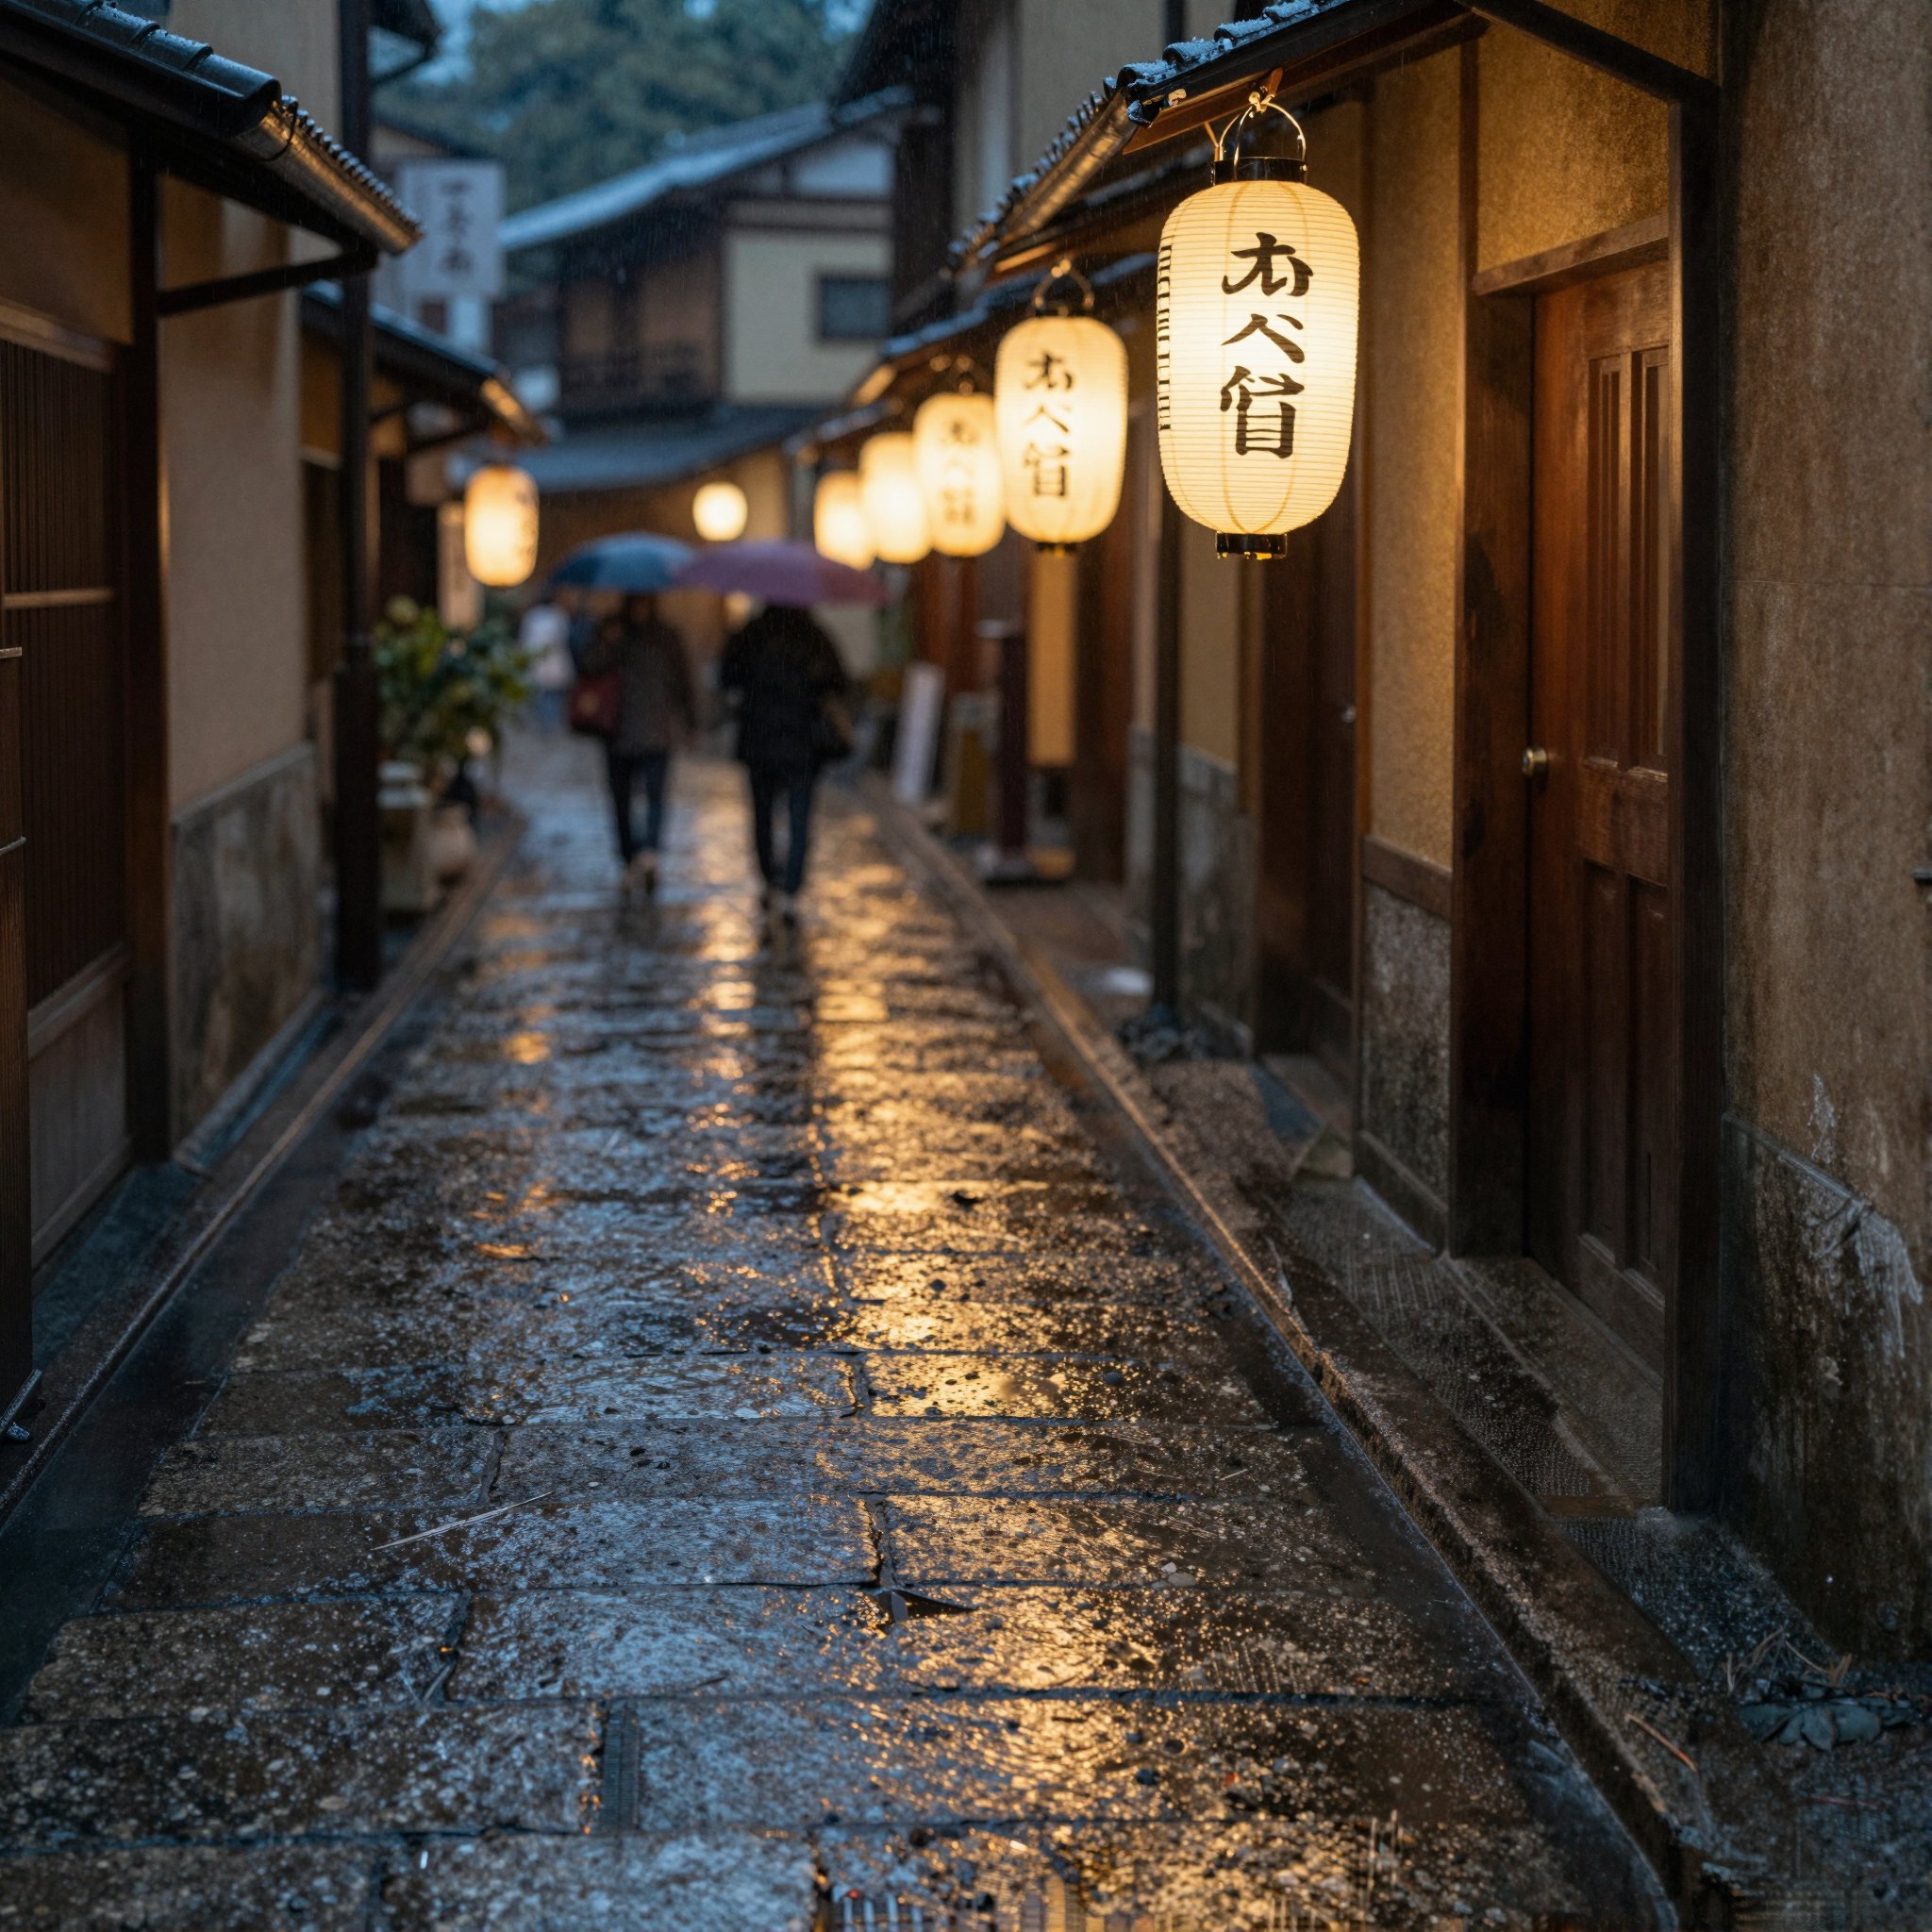

Base and after RL. “A narrow street in Kyoto at night in the rain, paper lanterns glowing, reflections on wet stone”
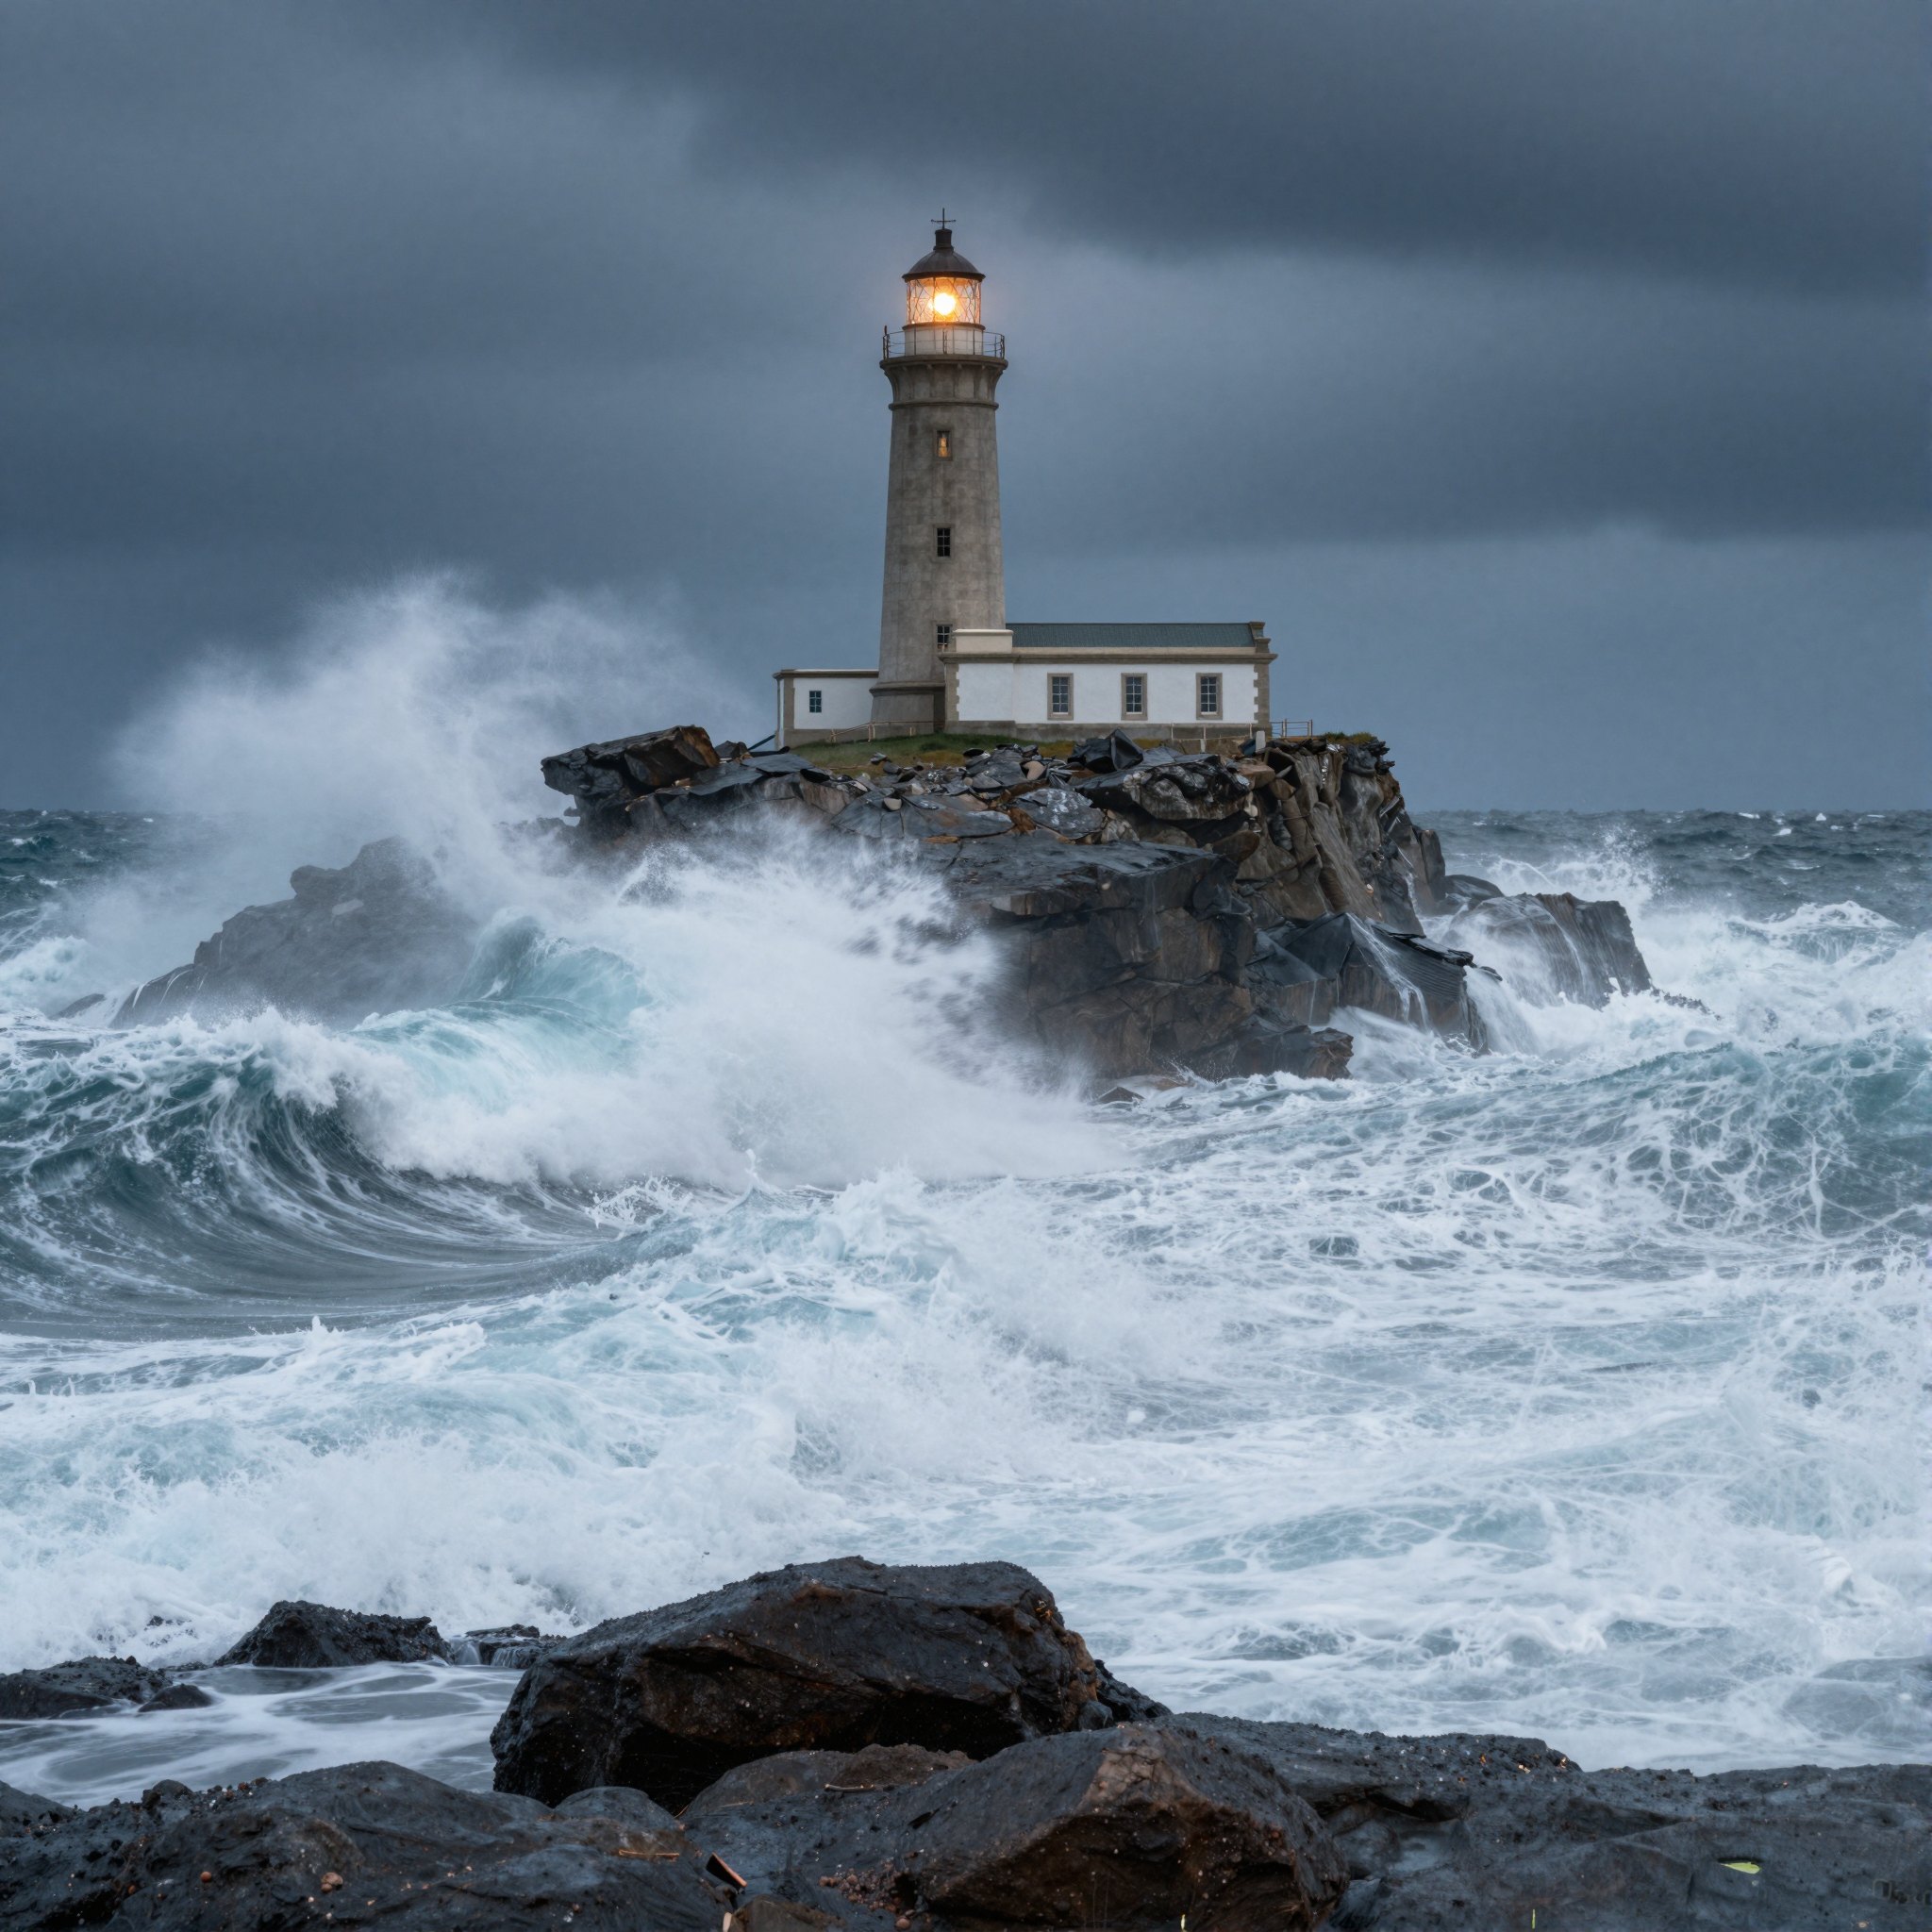

Base and after RL. “A lighthouse on a rocky cliff during a storm, huge waves crashing, dramatic sky”
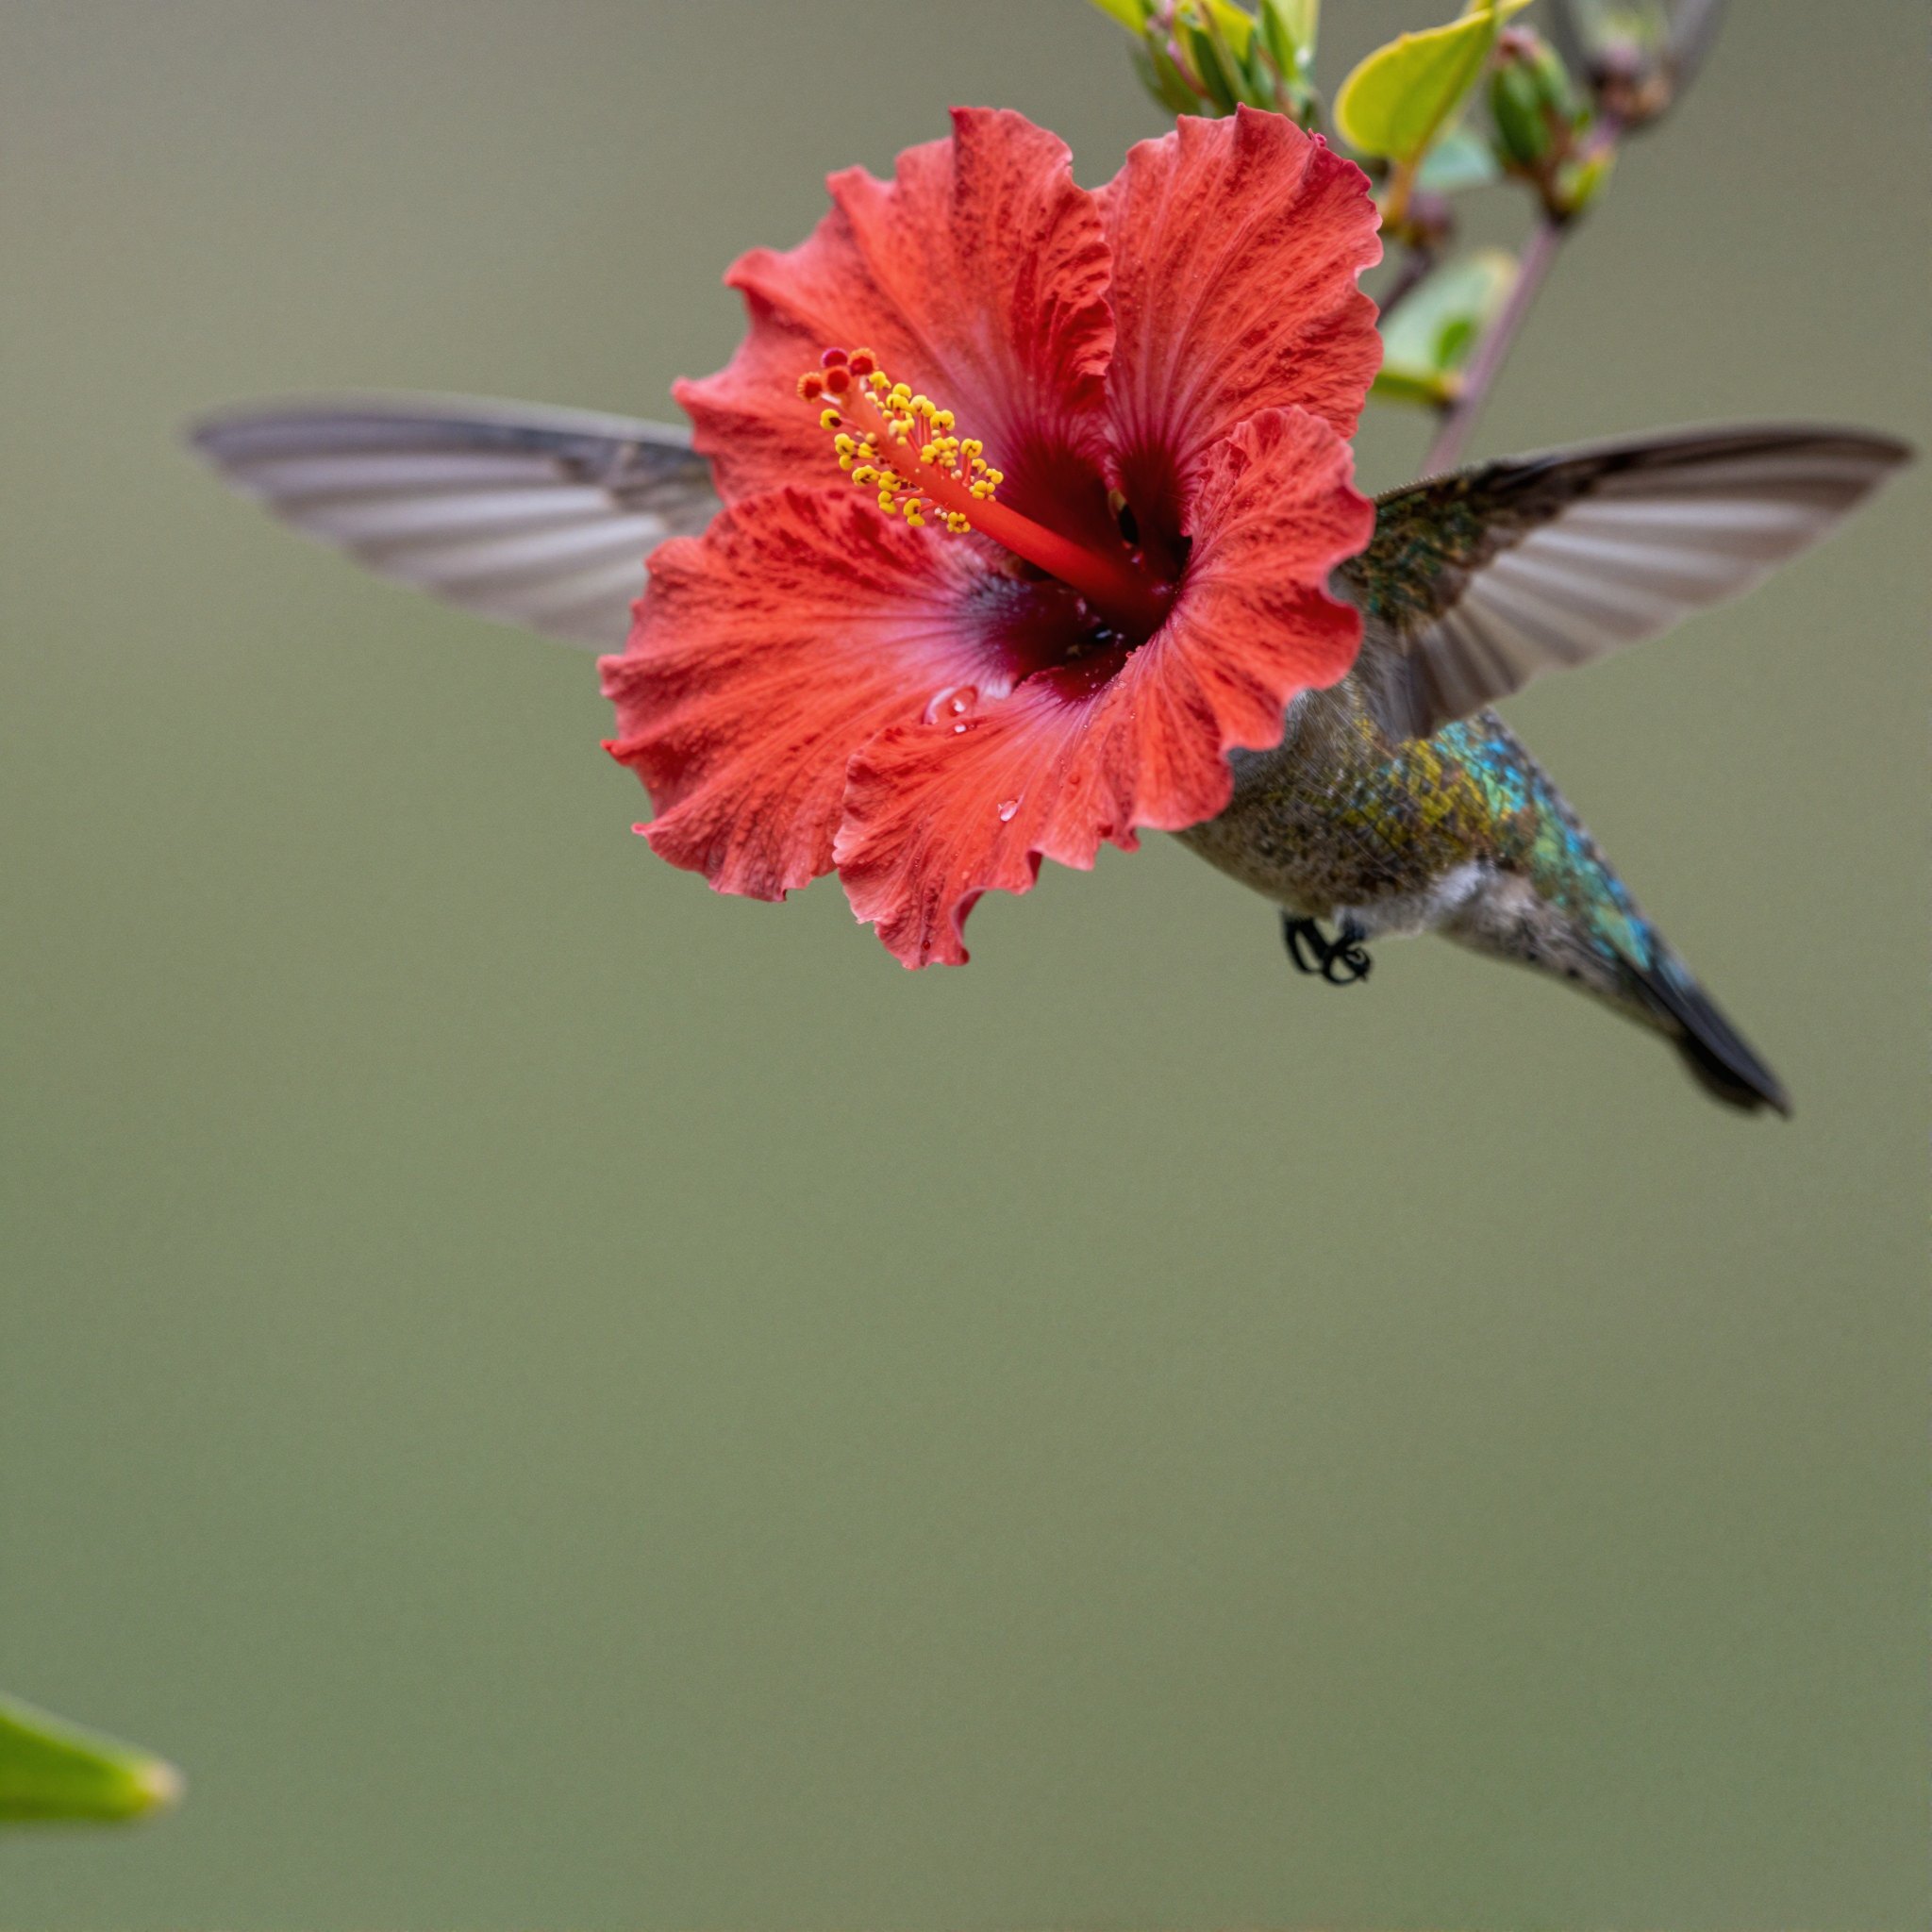

Base and after RL. “A hummingbird hovering next to a red hibiscus flower, frozen wings, macro photography”
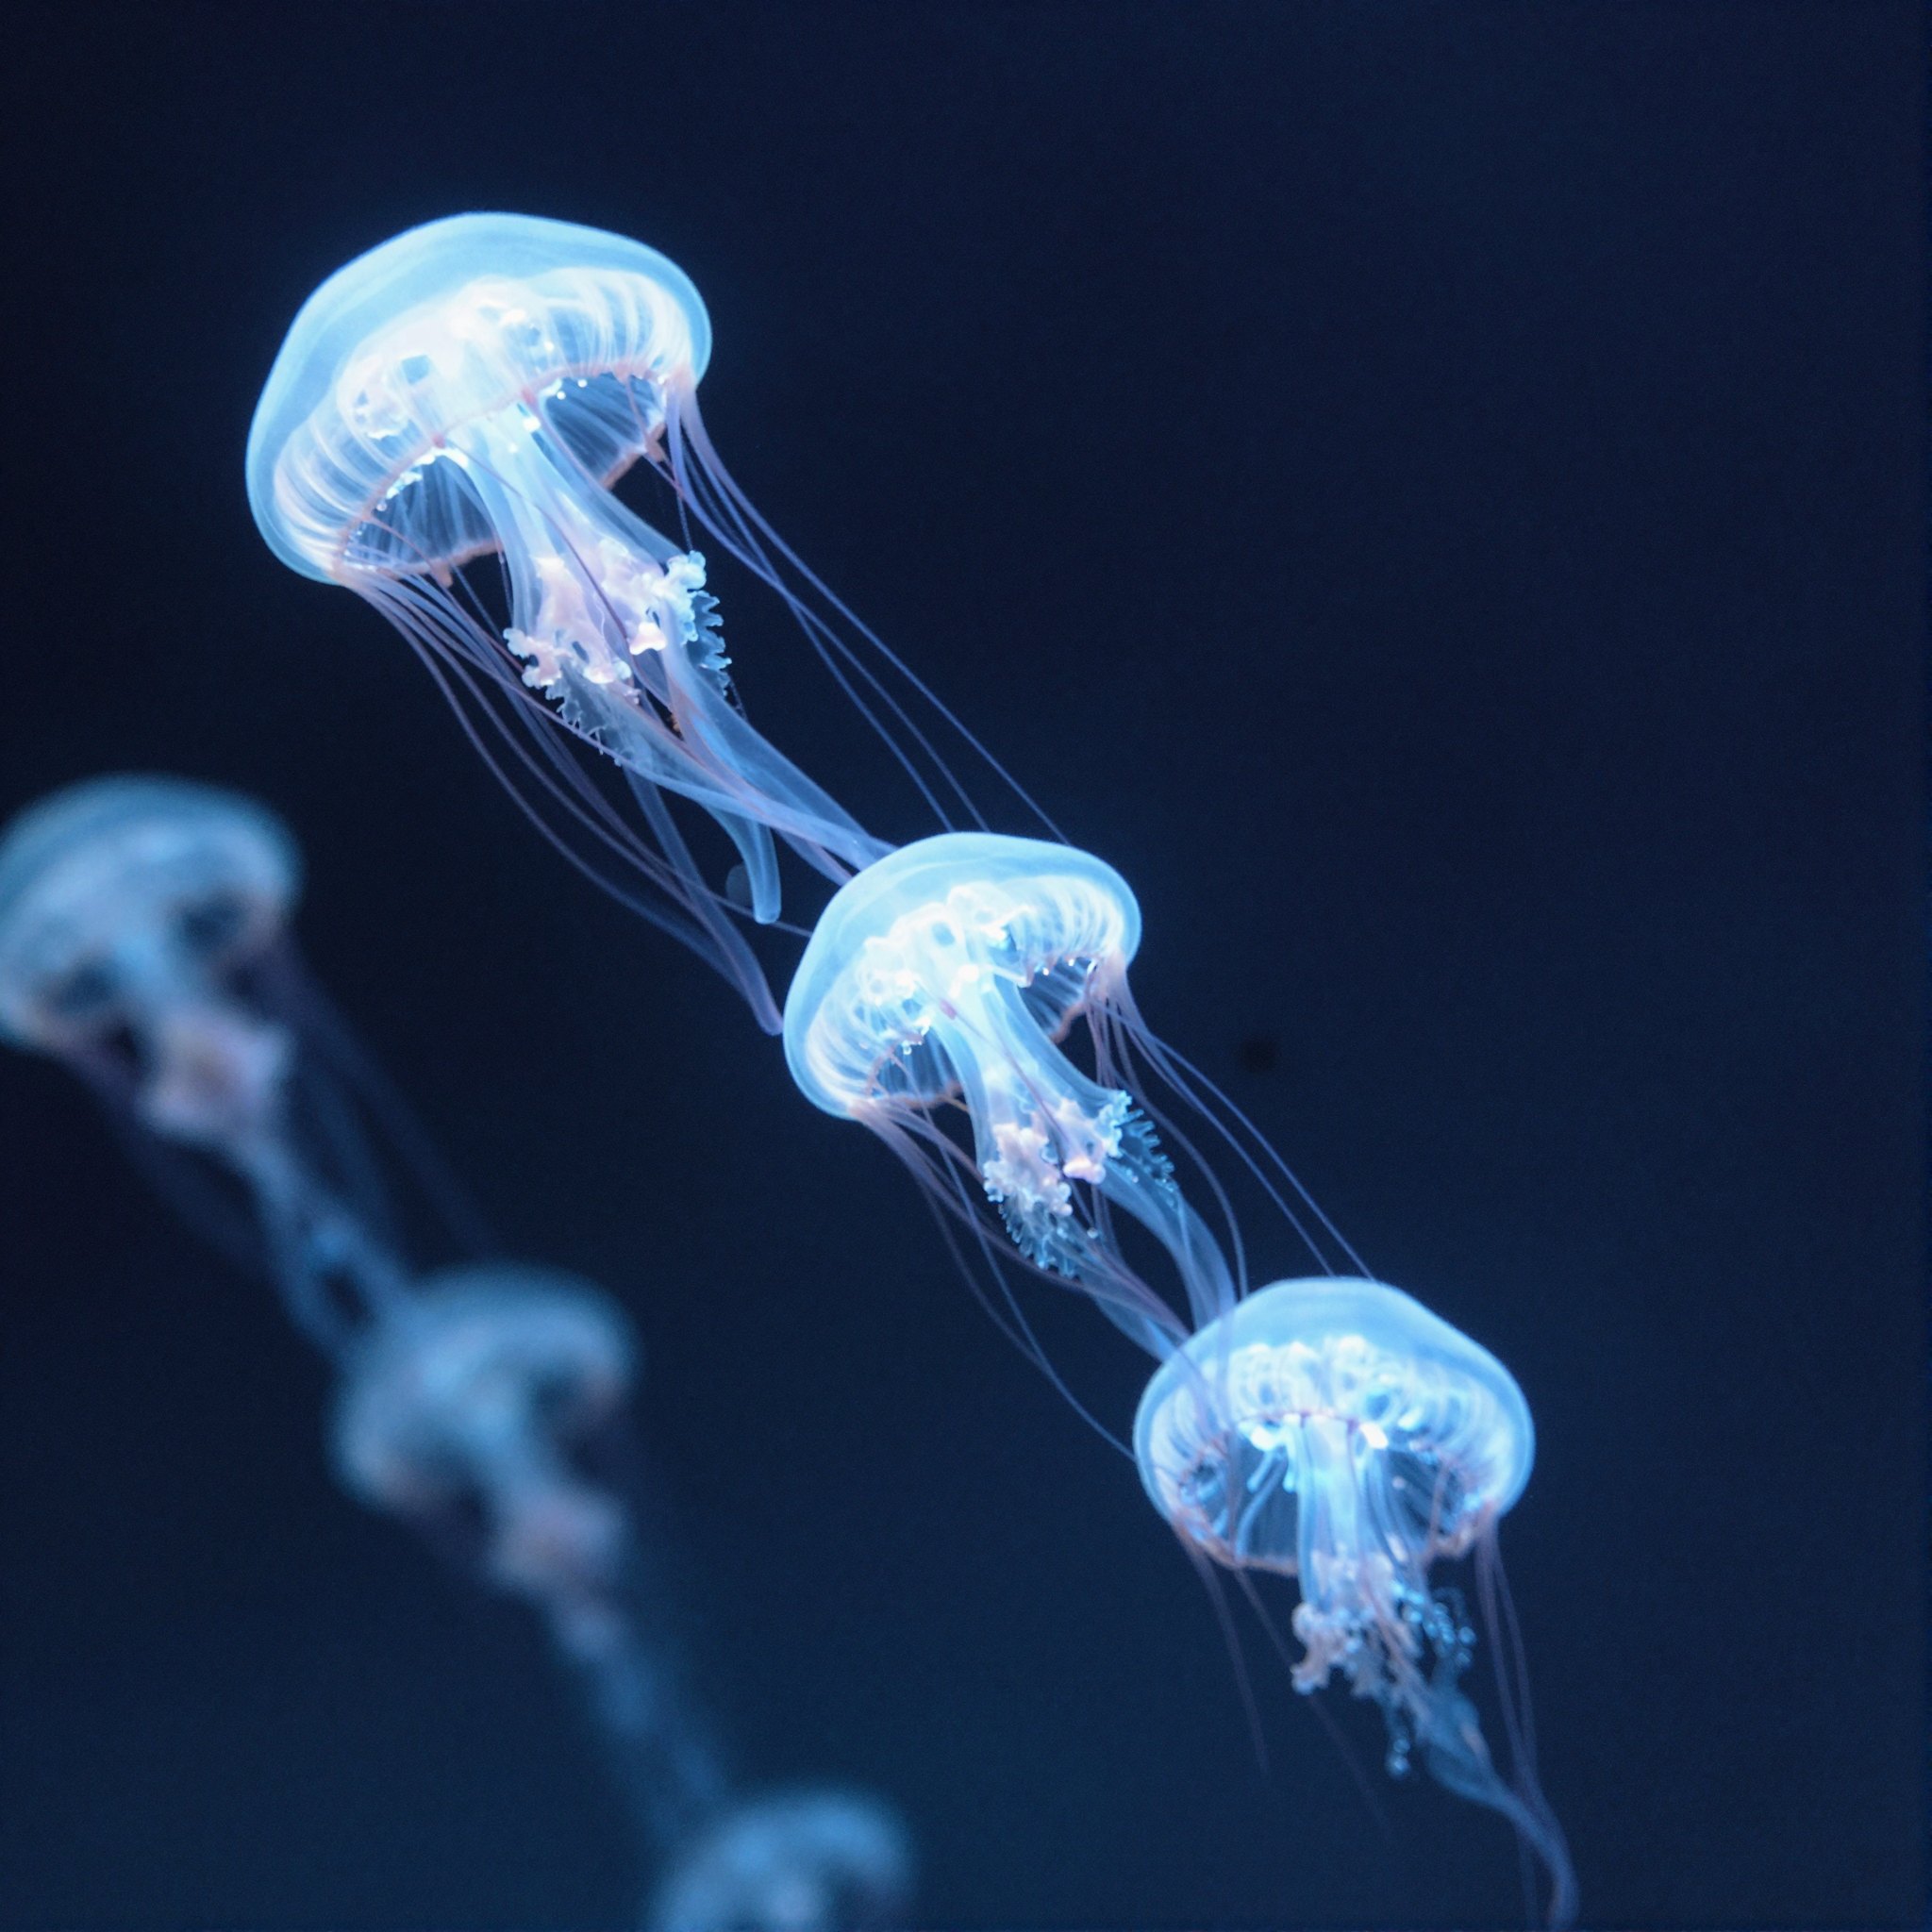

Base and after RL. “Bioluminescent jellyfish drifting in the deep ocean, soft blue glow”
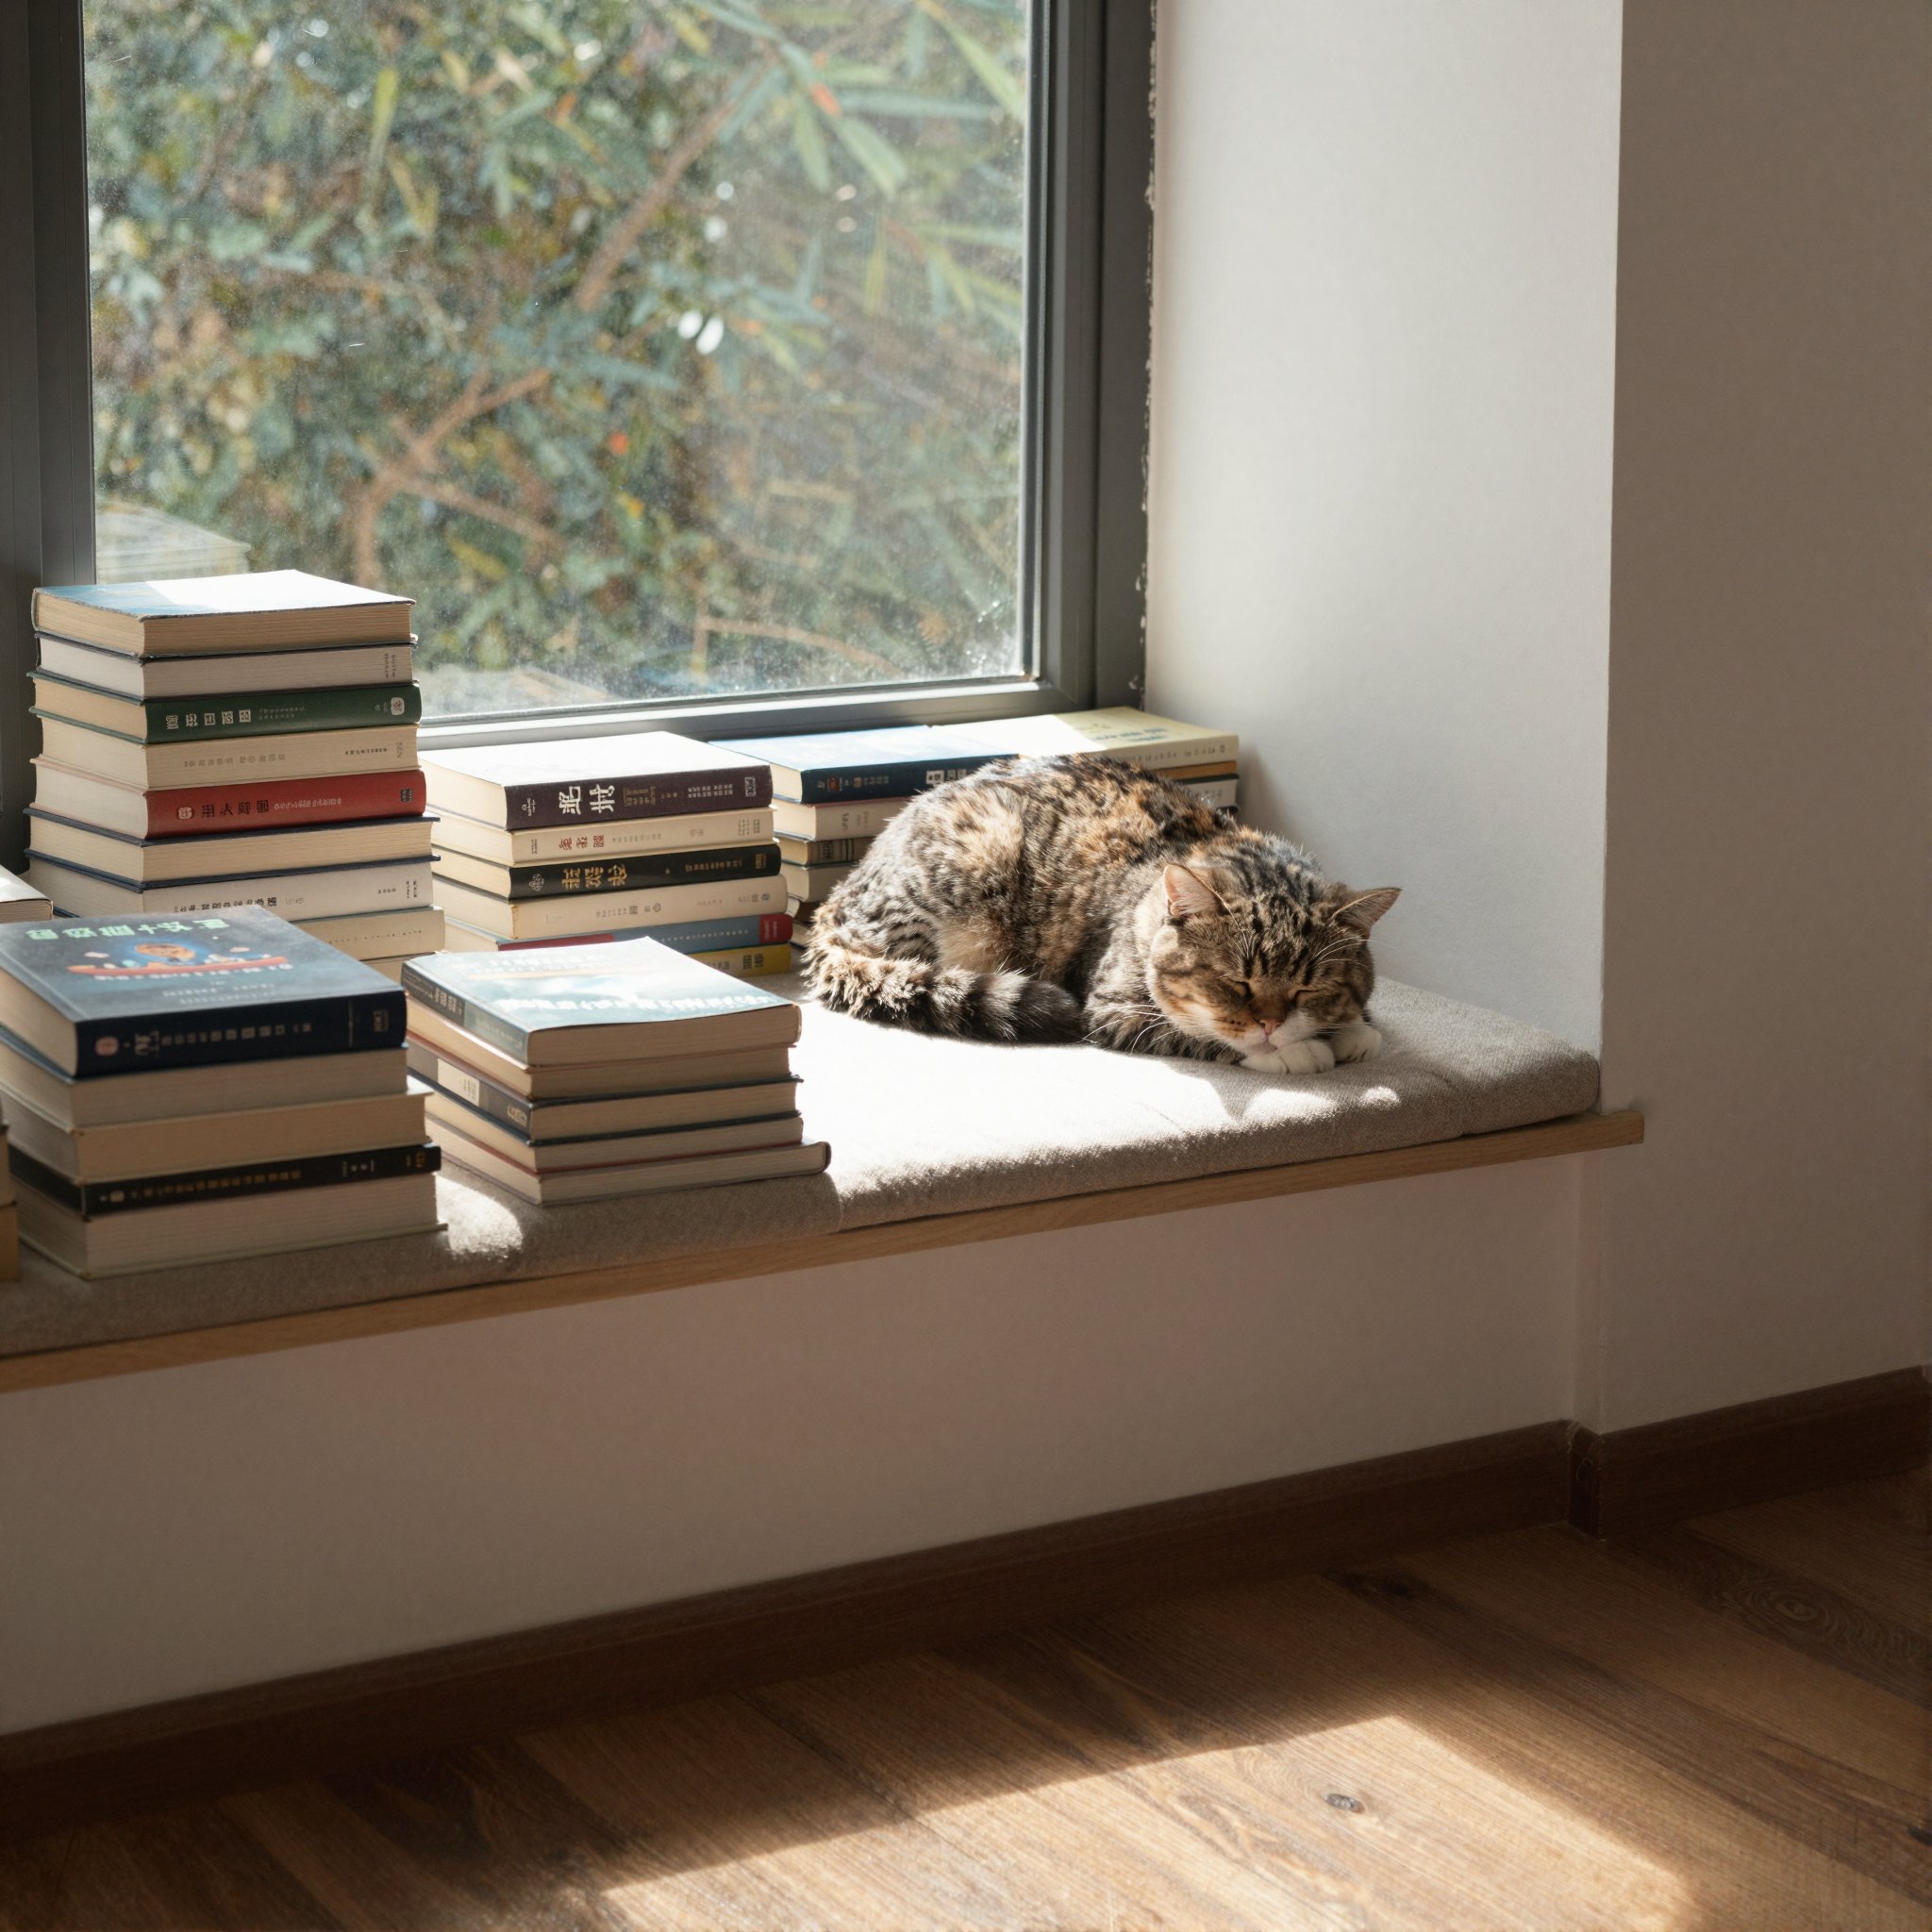

Base and after RL. “A cozy reading nook with a window seat, afternoon sun, stacks of books and a sleeping cat”
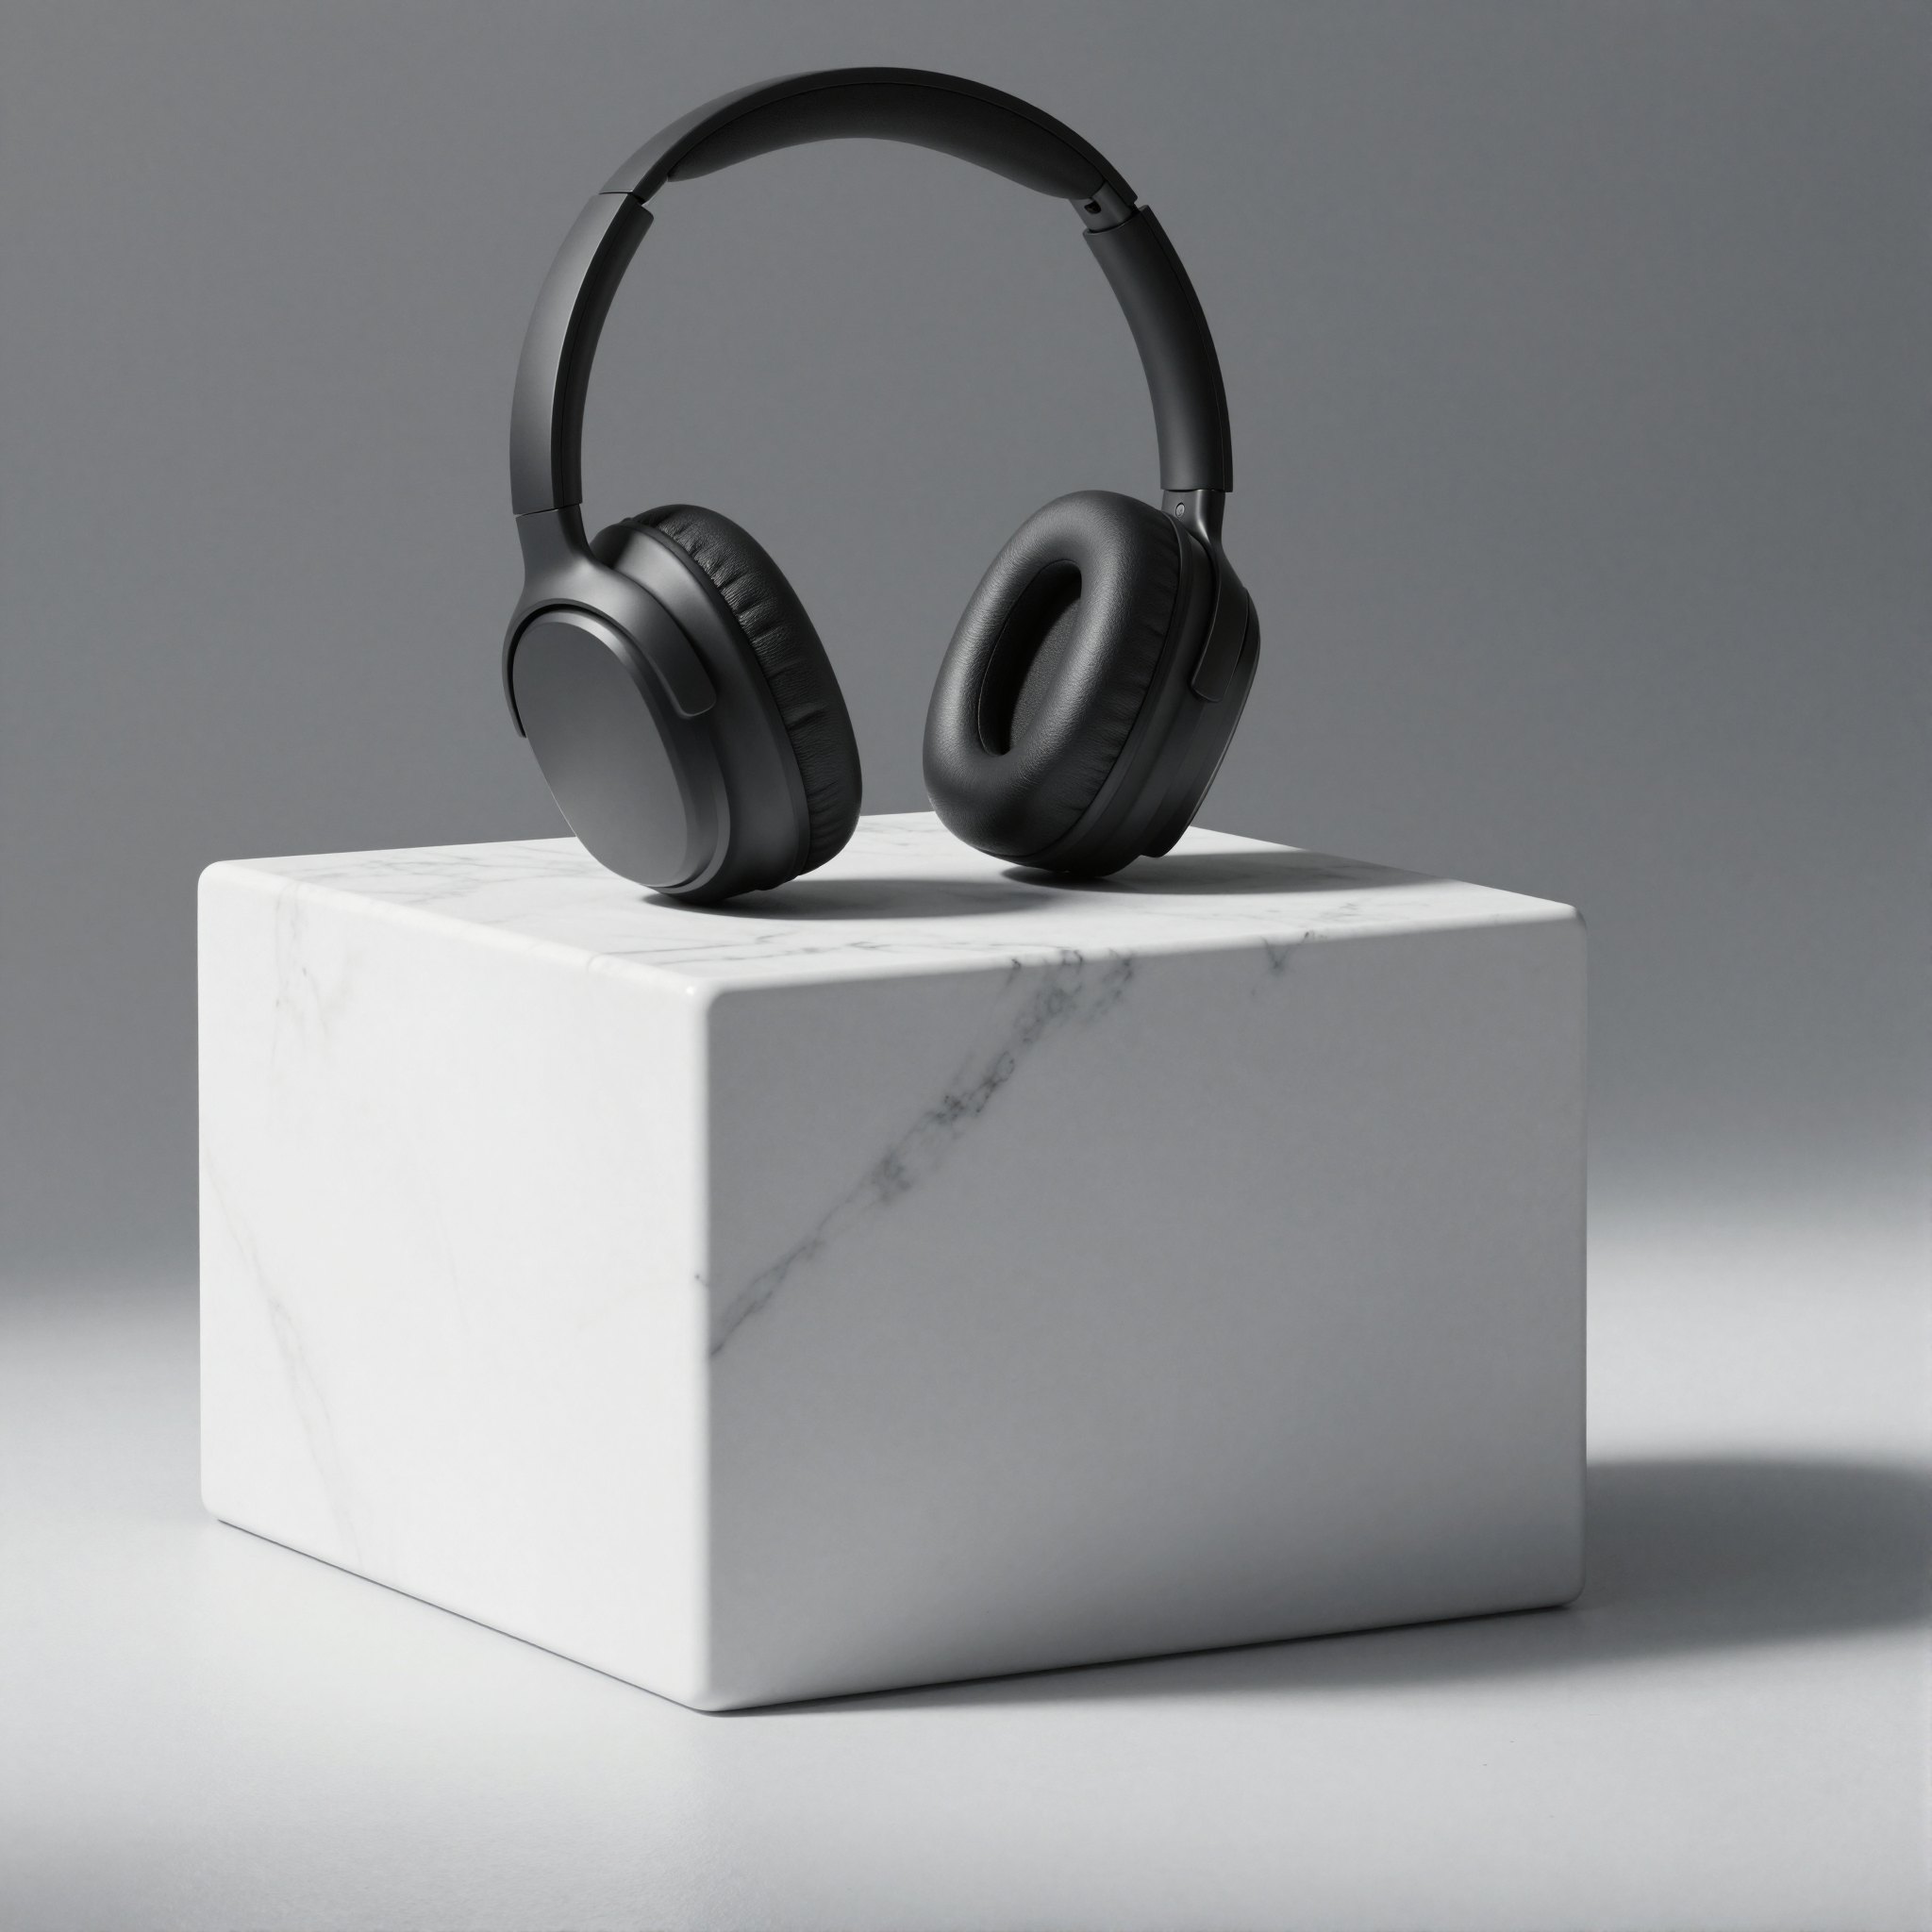

Base and after RL. “A minimalist product shot of matte black wireless headphones on a white marble pedestal”
What these measurements suggest
- RL changes the reward distribution during training. Best-of-N selects from that distribution at inference. Both matter when a product reranks generated candidates.
- On the checkpoints and scorers tested here, RL reduces the gain from additional samples, while retaining its lead on the rewards it improves within our measured budgets.
- Report results for more than one scorer. The same checkpoint can outperform 32 base samples on its training reward and fall below one base sample on another metric.
- Diversity scores and KL penalties do not tell you how much search you keep. The best-of-N curve does.
- The Z-Image-Turbo checkpoint starts with low diversity and gains little from search. Testing more distilled models would show how broadly that result holds.
Open problems
- Report RL in samples. Next to mean reward, publish the best-of-N curve and the search-equivalent budget on at least one held-out scorer. The estimator below turns 32 samples per prompt into the whole curve.
- When is RL cheaper than search? For \(N_{\mathrm{eq}}>1\), equal per-sample costs give a rough break-even of \(C_{\mathrm{train}}/((N_{\mathrm{eq}}-1)C_{\mathrm{sample}})\) queries. This excludes scoring, serving overhead, and differences between samplers. We did not measure that full cost comparison here.
- Train for the search you deploy. If the product reranks N images, the objective should be \(J_N\), not \(J_{\text{RL}}\). Pass@k and max@k objectives are one route[1][2], and a first max@k method for text-to-image diversity already exists[21]. Raising \(\mu\) while keeping \(\sigma\) is the target.
- Measure useful diversity. We need a diversity metric that predicts search gain for a given scorer, rather than distance between pixels or embeddings.
- Rerank with a different judge. Training on PickScore and reranking with a prompt-faithfulness scorer could recover part of what RL removed. How far this goes is open.
- Smarter search. We only tested independent sampling. Noise-space search and particle methods[22][8] steer generation and may interact with RL very differently.
- Post-train distilled models without losing spread. Turbo models start with little variety. RL for them should raise the mean without spending what is left.
from math import comb
import numpy as np

def best_of_n(scores, N):
    """Exact E[max of N] from n >= N scored samples of one prompt."""
    s = np.sort(scores); n = len(s)
    w = [comb(m - 1, N - 1) / comb(n, N) for m in range(1, n + 1)]
    return float(np.dot(w, s))
How we ran this
We built the evaluation ourselves and ran every model in this post end to end on our own GPUs: sampling, scoring, the best-of-N estimator and the search-equivalent budget. We did not retrain the RL models. We used the checkpoints their authors released, so the numbers describe the models people download.
| Item | Setting |
|---|---|
| Models | SD3.5-Medium base. Flow-GRPO PickScore, with KL (jieliu/SD3.5M-FlowGRPO-PickScore) and without. DiffusionNFT multi-reward (worstcoder/SD3.5M-DiffusionNFT-MultiReward). Z-Image-Turbo base and a PickScore RL LoRA from DiffusionOPSD. |
| Sampling | SD3.5-M: 40-step Euler flow ODE at 512 px; Flow-GRPO and its base at CFG 4.5 with an empty negative prompt, DiffusionNFT and its base without guidance. Z-Image-Turbo: 9-step flow-matching Euler, no guidance, bf16 transformer and fp32 VAE, 1024 px for curves and 2048 px for the gallery. |
| Noise | Each image starts from its own generator seeded by (seed, prompt index), so every model begins from identical noise for the same prompt and seed. |
| Prompts | SD3.5-M: first 100 unique DrawBench prompts, 32 seeds each (3,200 images per model). Z-Image-Turbo: first 50 DrawBench prompts with 16 seeds, 8 written prompts with 16 seeds for the panels, 12 with 4 seeds at 2048 px for the gallery. |
| Scorers | PickScore v1 (CLIP ViT-H/14), HPSv2.1, HPSv3, ImageReward, CLIPScore (CLIP ViT-L/14), aesthetic predictor. DreamSim distance and Vendi score for diversity. |
| Statistics | Exact order-statistic best-of-N, averaged over prompts. 95% intervals from 2,000 paired bootstrap resamples of prompts. Search-equivalent budget interpolated on the base curve in log N. |
| Scope | Independent best-of-N only. NVIDIA GH200 GPUs on TACC Vista. |
References
- Z. Chen, X. Qin, Y. Wu et al., Pass@k Training for Adaptively Balancing Exploration and Exploitation of Large Reasoning Models, 2025.
- C. Walder, D. Karkhanis, Pass@K Policy Optimization: Solving Harder Reinforcement Learning Problems, 2025.
- A. Balashankar, Z. Sun, J. Berant et al., InfAlign: Inference-aware language model alignment, 2024.
- J. Liu, G. Liu, J. Liang et al., Flow-GRPO: Training Flow Matching Models via Online RL, 2025.
- Y. Kirstain, A. Polyak, U. Singer et al., Pick-a-Pic: An Open Dataset of User Preferences for Text-to-Image Generation, 2023.
- X. Wu, Y. Hao, K. Sun et al., Human Preference Score v2: A Solid Benchmark for Evaluating Human Preferences of Text-to-Image Synthesis, 2023.
- K. Zheng, H. Chen, H. Ye et al., DiffusionNFT: Online Diffusion Reinforcement with Forward Process, 2025.
- N. Ma, S. Tong, H. Jia et al., Inference-Time Scaling for Diffusion Models beyond Scaling Denoising Steps, 2025.
- P. Esser, S. Kulal, A. Blattmann et al., Scaling Rectified Flow Transformers for High-Resolution Image Synthesis, 2024.
- J. Ho, T. Salimans, Classifier-Free Diffusion Guidance, 2022.
- C. Saharia, W. Chan, S. Saxena et al., Photorealistic Text-to-Image Diffusion Models with Deep Language Understanding, 2022.
- Y. Ma, Y. Shui, X. Wu et al., HPSv3: Towards Wide-Spectrum Human Preference Score, 2025.
- J. Xu, X. Liu, Y. Wu et al., ImageReward: Learning and Evaluating Human Preferences for Text-to-Image Generation, 2023.
- J. Hessel, A. Holtzman, M. Forbes et al., CLIPScore: A Reference-free Evaluation Metric for Image Captioning, 2021.
- C. Schuhmann, CLIP+MLP Aesthetic Score Predictor (improved-aesthetic-predictor), 2022.
- Z-Image Team, Z-Image: An Efficient Image Generation Foundation Model with Single-Stream Diffusion Transformer, 2025.
- M. Chen, J. Tworek, H. Jun et al., Evaluating Large Language Models Trained on Code, 2021.
- S. Fu, N. Tamir, S. Sundaram et al., DreamSim: Learning New Dimensions of Human Visual Similarity using Synthetic Data, 2023.
- D. Friedman, A. B. Dieng, The Vendi Score: A Diversity Evaluation Metric for Machine Learning, 2022.
- W. Zhou, X. Zhu, L. Kong et al., On-Policy Self-Distillation in Diffusion Models, 2026.
- K. Onoda, P. Parmas, H. Furuta et al., Multi-Axis Max@K Reinforcement Learning for Representative Diversity in Text-to-Image Generation, 2026.
- R. Singhal, Z. Horvitz, R. Teehan et al., A General Framework for Inference-time Scaling and Steering of Diffusion Models, 2025.
Citation
@misc{saini2026rlworthn,
  author       = {Saini, Shreshth},
  title        = {RL Is Worth N Samples},
  year         = {2026},
  month        = {September},
  howpublished = {\url{https://shreshthsaini.github.io/blogs/rl-worth-n-samples.html}},
  note         = {Blog post}
}